29
/de/
de
AIzaSyAYiBZKx7MnpbEhh9jyipgxe19OcubqV5w
April 1, 2024
73290
Australia
AUS
true
2
1
Nitrous oxide emissions (thousand metric tons of CO2 equivalent)
2013,2012,2011,2010,2009,2008,2007,2006,2005,2004,2003,2002,2001,2000,1999,1998,1997,1996,1995,1994,1993,1992,1991,1990,1989,1988,1987,1986,1985,1984,1983,1982,1981,1980,1979,1978,1977,1976,1975,1974,1973,1972,1971
Diese Statistik in anderen Ländern:
AfghanistanAlbaniaAlgeriaAmerican SamoaAndorraAngolaAntigua and BarbudaArab WorldArgentinaArmeniaArubaAustraliaAustriaAzerbaijanBahamas, TheBahrainBangladeshBarbadosBelarusBelgiumBelizeBeninBermudaBhutanBoliviaBosnia and HerzegovinaBotswanaBrazilBritish Virgin IslandsBrunei DarussalamBulgariaBurkina FasoBurundiCabo VerdeCambodiaCameroonCanadaCaribbean small statesCayman IslandsCentral African RepublicCentral Europe and the BalticsChadChileChinaColombiaComorosCongo, Dem. Rep.Congo, Rep.Costa RicaCote d'IvoireCroatiaCubaCyprusCzech RepublicDenmarkDjiboutiDominicaDominican RepublicEarly-demographic dividendEast Asia & PacificEast Asia & Pacific (excluding high income)East Asia & Pacific (IDA & IBRD countries)EcuadorEgypt, Arab Rep.El SalvadorEquatorial GuineaEritreaEstoniaEthiopiaEuro areaEurope & Central AsiaEurope & Central Asia (excluding high income)Europe & Central Asia (IDA & IBRD countries)European UnionFaroe IslandsFijiFinlandFragile and conflict affected situationsFranceFrench PolynesiaGabonGambia, TheGeorgiaGermanyGhanaGibraltarGreeceGreenlandGrenadaGuamGuatemalaGuineaGuinea-BissauGuyanaHaitiHeavily indebted poor countries (HIPC)High incomeHondurasHong Kong SAR, ChinaHungaryIBRD onlyIcelandIDA & IBRD totalIDA blendIDA onlyIDA totalIndiaIndonesiaIran, Islamic Rep.IraqIrelandIsraelItalyJamaicaJapanJordanKazakhstanKenyaKiribatiKorea, Dem. People’s Rep.Korea, Rep.KosovoKuwaitKyrgyz RepublicLao PDRLate-demographic dividendLatin America & Caribbean Latin America & Caribbean (excluding high income)Latin America & the Caribbean (IDA & IBRD countries)LatviaLeast developed countries: UN classificationLebanonLesothoLiberiaLibyaLithuaniaLow & middle incomeLow incomeLower middle incomeLuxembourgMacao SAR, ChinaMacedonia, FYRMadagascarMalawiMalaysiaMaldivesMaliMaltaMarshall IslandsMauritaniaMauritiusMexicoMicronesia, Fed. Sts.Middle East & North AfricaMiddle East & North Africa (excluding high income)Middle East & North Africa (IDA & IBRD countries)Middle incomeMoldovaMongoliaMontenegroMoroccoMozambiqueMyanmarNamibiaNauruNepalNetherlandsNew CaledoniaNew ZealandNicaraguaNigerNigeriaNorth AmericaNorthern Mariana IslandsNorwayOECD membersOmanOther small statesPacific island small statesPakistanPalauPanamaPapua New GuineaParaguayPeruPhilippinesPolandPortugalPost-demographic dividendPre-demographic dividendPuerto RicoQatarRomaniaRussian FederationRwandaSamoaSao Tome and PrincipeSaudi ArabiaSenegalSerbiaSeychellesSierra LeoneSingaporeSlovak RepublicSloveniaSmall statesSolomon IslandsSomaliaSouth AfricaSouth AsiaSouth Asia (IDA & IBRD)SpainSri LankaSt. Kitts and NevisSt. LuciaSt. Vincent and the GrenadinesSub-Saharan Africa Sub-Saharan Africa (excluding high income)Sub-Saharan Africa (IDA & IBRD countries)SudanSurinameSwazilandSwedenSwitzerlandSyrian Arab RepublicTajikistanTanzaniaThailandTimor-LesteTogoTongaTrinidad and TobagoTunisiaTurkeyTurkmenistanTurks and Caicos IslandsTuvaluUgandaUkraineUnited Arab EmiratesUnited KingdomUnited StatesUpper middle incomeUruguayUzbekistanVanuatuVenezuela, RBVietnamVirgin Islands (U.S.)WorldYemen, Rep.ZambiaZimbabwe Zeitlinie:
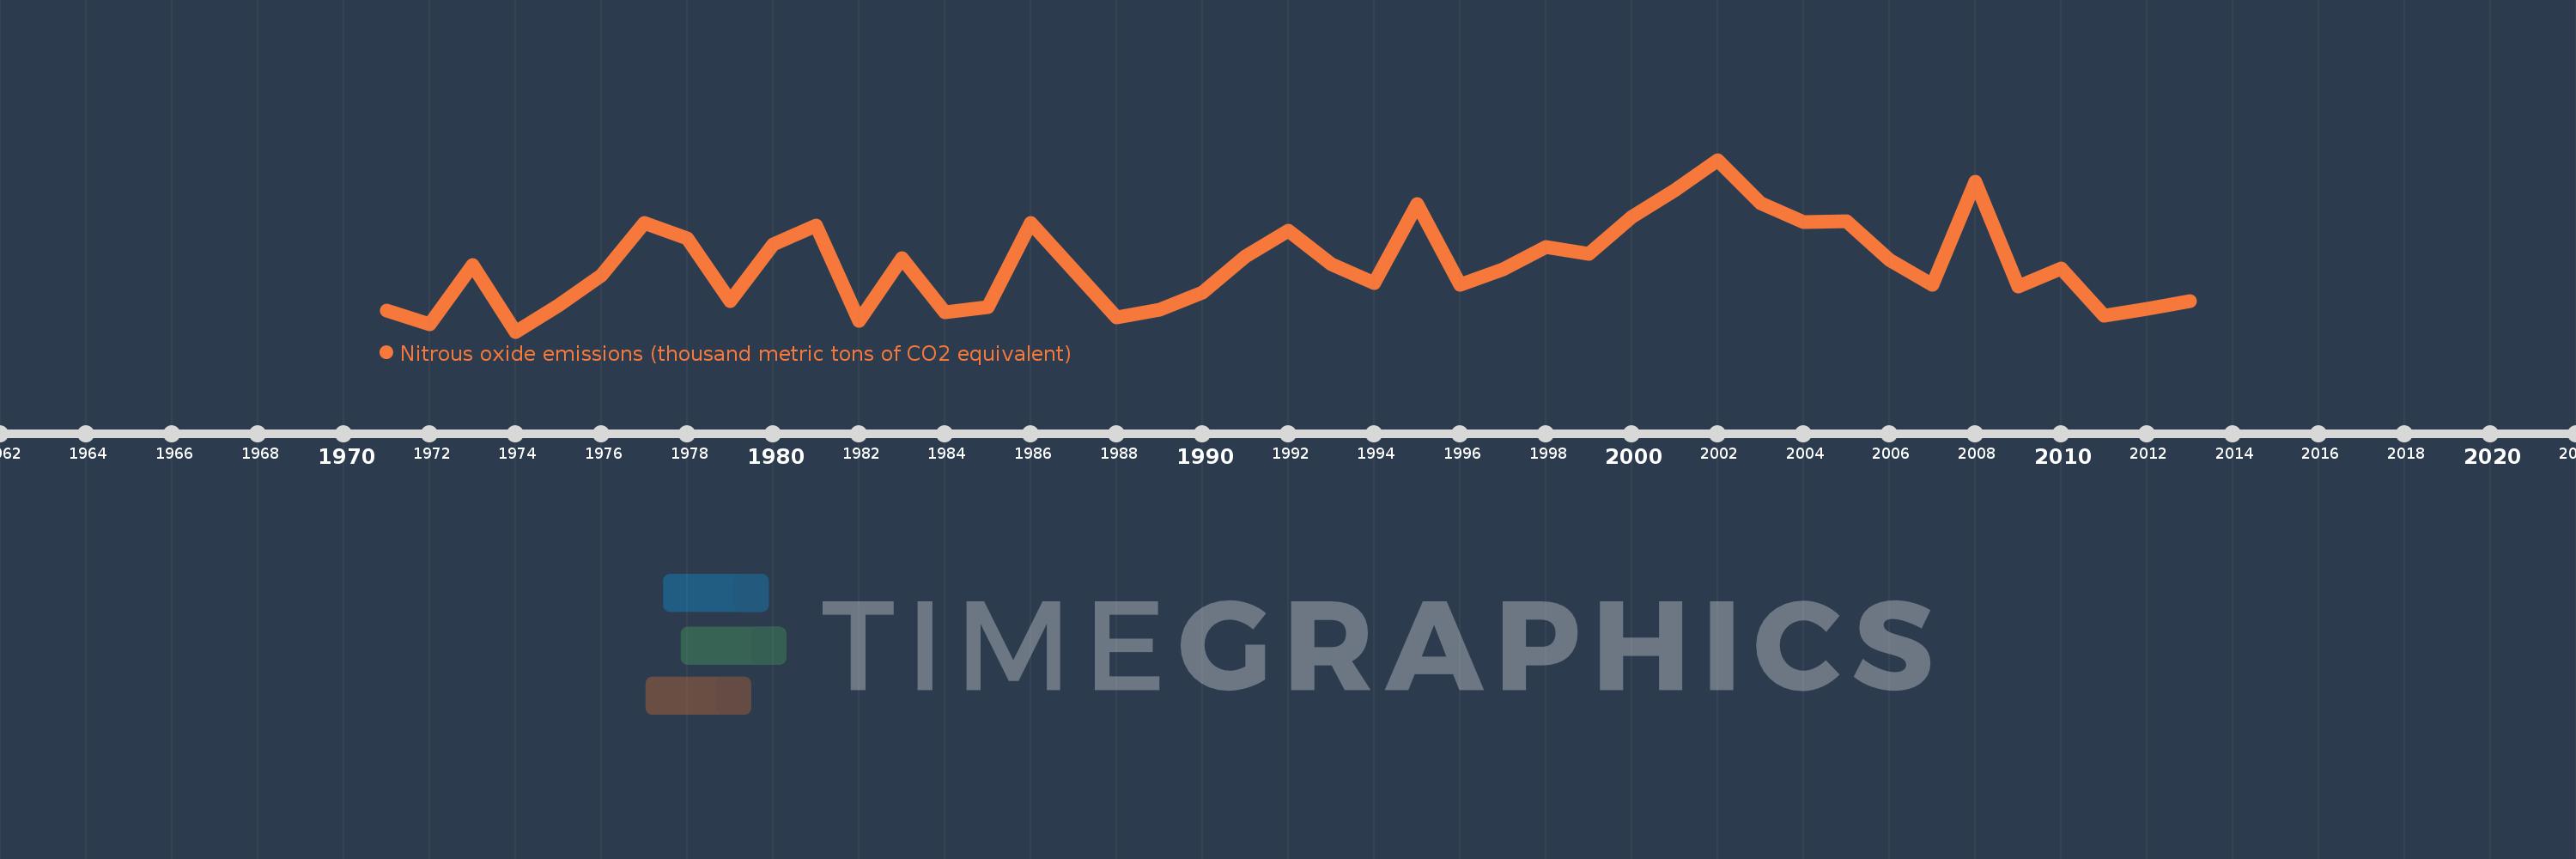
Diese Zeitleiste vorliegt die Graphik ab 1971 J. bis 2013 J. Australia. Die Angaben bis 1970 J. sind nicht vorhanden. Die Zahl aktueller Beobachtungen nach Daten: 43.
Die Quelle (Bezeichnung):
Kennzahlen der Weltentwicklung
Die Quelle (Einrichtung):
European Commission, Joint Research Centre (JRC)/Netherlands Environmental Assessment Agency (PBL). Emission Database for Global Atmospheric Research (EDGAR): http://edgar.jrc.ec.europa.eu/
Kategorien:
Climate Change, Environment
Es wurde aktualisiert:
23 Apr 2017 Jahr
Kennzahlen der Wertänderungen vom Jahr zum Jahr
im Durchschnitt:
61.374 Tsnd.
Minimum:
48.458 Tsnd.
1 Jan 1974 Jahr
Maximum:
81.508 Tsnd.
1 Jan 2002 Jahr
Zum Datum der Beobachtung
Wert
Absolute Veränderung
Die Veränderung bezüglich dem vorherigen Wert
1 Jan 1971 Jahr
52.433 Tsnd.
+52.433 Tsnd.
0.0%
1 Jan 1972 Jahr
49.79 Tsnd.
-2.643 Tsnd.
-5.04%
1 Jan 1973 Jahr
61.267 Tsnd.
+11.477 Tsnd.
23.05%
1 Jan 1974 Jahr
48.458 Tsnd.
-12.809 Tsnd.
-20.91%
1 Jan 1975 Jahr
53.545 Tsnd.
+5.087 Tsnd.
10.5%
1 Jan 1976 Jahr
59.253 Tsnd.
+5.709 Tsnd.
10.66%
1 Jan 1977 Jahr
69.356 Tsnd.
+10.102 Tsnd.
17.05%
1 Jan 1978 Jahr
66.314 Tsnd.
-3.041 Tsnd.
-4.39%
1 Jan 1979 Jahr
54.317 Tsnd.
-11.997 Tsnd.
-18.09%
1 Jan 1980 Jahr
65.182 Tsnd.
+10.864 Tsnd.
20.0%
1 Jan 1981 Jahr
68.824 Tsnd.
+3.642 Tsnd.
5.59%
1 Jan 1982 Jahr
50.442 Tsnd.
-18.381 Tsnd.
-26.71%
1 Jan 1983 Jahr
62.563 Tsnd.
+12.121 Tsnd.
24.03%
1 Jan 1984 Jahr
52.197 Tsnd.
-10.367 Tsnd.
-16.57%
1 Jan 1985 Jahr
53.16 Tsnd.
+963.17
1.85%
1 Jan 1986 Jahr
69.422 Tsnd.
+16.262 Tsnd.
30.59%
1 Jan 1987 Jahr
60.233 Tsnd.
-9.189 Tsnd.
-13.24%
1 Jan 1988 Jahr
51.143 Tsnd.
-9.09 Tsnd.
-15.09%
1 Jan 1989 Jahr
52.742 Tsnd.
+1.599 Tsnd.
3.13%
1 Jan 1990 Jahr
55.954 Tsnd.
+3.212 Tsnd.
6.09%
1 Jan 1991 Jahr
62.893 Tsnd.
+6.94 Tsnd.
12.4%
1 Jan 1992 Jahr
67.896 Tsnd.
+5.002 Tsnd.
7.95%
1 Jan 1993 Jahr
61.43 Tsnd.
-6.466 Tsnd.
-9.52%
1 Jan 1994 Jahr
57.722 Tsnd.
-3.707 Tsnd.
-6.04%
1 Jan 1995 Jahr
73.007 Tsnd.
+15.284 Tsnd.
26.48%
1 Jan 1996 Jahr
57.486 Tsnd.
-15.52 Tsnd.
-21.26%
1 Jan 1997 Jahr
60.475 Tsnd.
+2.989 Tsnd.
5.2%
1 Jan 1998 Jahr
64.776 Tsnd.
+4.301 Tsnd.
7.11%
1 Jan 1999 Jahr
63.49 Tsnd.
-1.286 Tsnd.
-1.98%
1 Jan 2000 Jahr
70.555 Tsnd.
+7.065 Tsnd.
11.13%
1 Jan 2001 Jahr
75.581 Tsnd.
+5.026 Tsnd.
7.12%
1 Jan 2002 Jahr
81.508 Tsnd.
+5.927 Tsnd.
7.84%
1 Jan 2003 Jahr
73.204 Tsnd.
-8.304 Tsnd.
-10.19%
1 Jan 2004 Jahr
69.508 Tsnd.
-3.696 Tsnd.
-5.05%
1 Jan 2005 Jahr
69.619 Tsnd.
+111.29
0.16%
1 Jan 2006 Jahr
62.283 Tsnd.
-7.336 Tsnd.
-10.54%
1 Jan 2007 Jahr
57.384 Tsnd.
-4.899 Tsnd.
-7.87%
1 Jan 2008 Jahr
77.307 Tsnd.
+19.923 Tsnd.
34.72%
1 Jan 2009 Jahr
57.169 Tsnd.
-20.138 Tsnd.
-26.05%
1 Jan 2010 Jahr
60.634 Tsnd.
+3.464 Tsnd.
6.06%
1 Jan 2011 Jahr
51.462 Tsnd.
-9.172 Tsnd.
-15.13%
1 Jan 2012 Jahr
52.855 Tsnd.
+1.393 Tsnd.
2.71%
1 Jan 2013 Jahr
54.247 Tsnd.
+1.393 Tsnd.
2.64%
Bewertung der Länder gemäß mit laufender Statistik nach Jahren


Kommentare: