29
/de/
de
AIzaSyAYiBZKx7MnpbEhh9jyipgxe19OcubqV5w
April 1, 2024
70639
Argentina
ARG
true
2
1
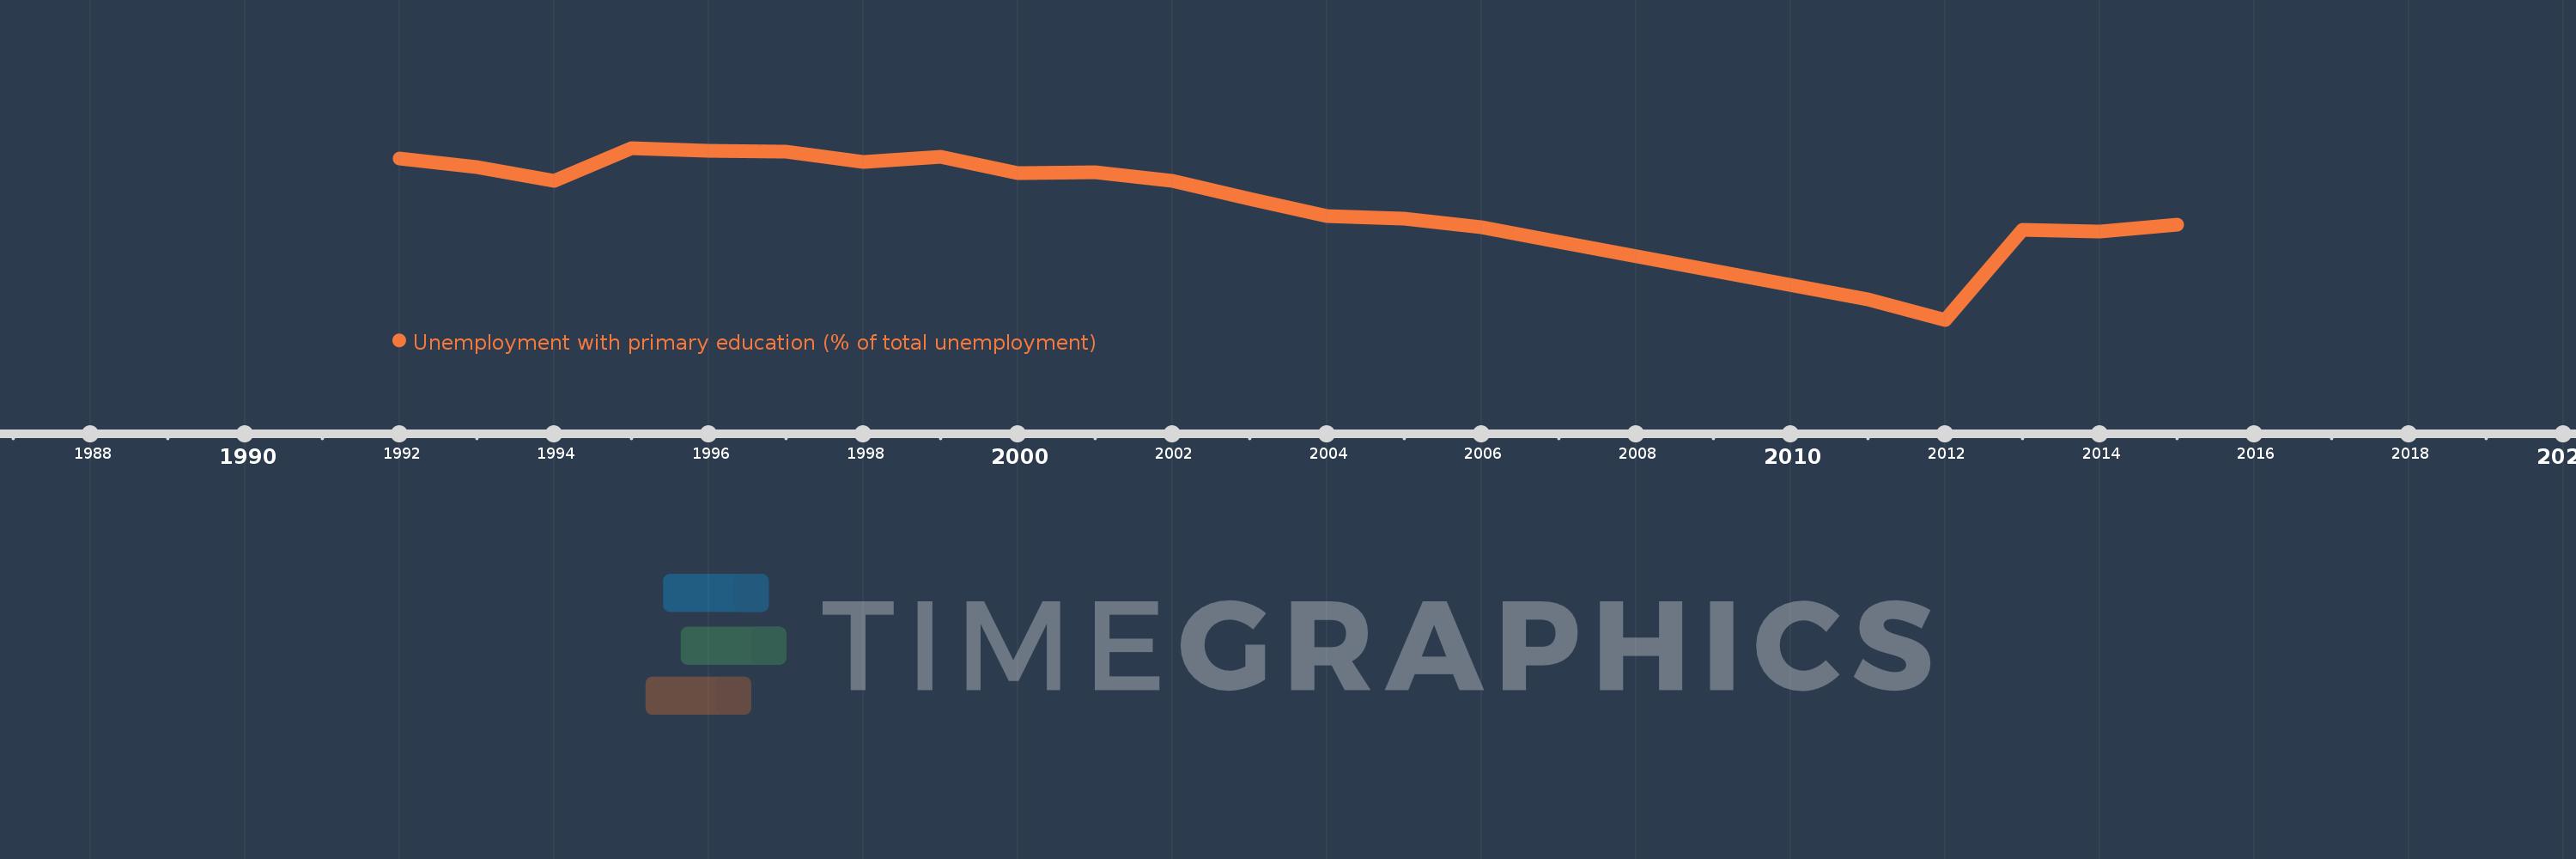
Unemployment with primary education (% of total unemployment)
2015,2014,2013,2012,2011,2007,2006,2005,2004,2003,2002,2001,2000,1999,1998,1997,1996,1995,1994,1993,1992
Diese Statistik in anderen Ländern:
Zeitlinie:
Diese Zeitleiste vorliegt die Graphik ab 1992 J. bis 2015 J. Argentina. Die Angaben bis 1991 J. sind nicht vorhanden. Die Zahl aktueller Beobachtungen nach Daten: 21.
Die Quelle (Bezeichnung):
Kennzahlen der Weltentwicklung
Die Quelle (Einrichtung):
International Labour Organization, Key Indicators of the Labour Market database.
Kategorien:
Social Protection & Labor
Es wurde aktualisiert:
23 Apr 2017 Jahr
Kennzahlen der Wertänderungen vom Jahr zum Jahr
Minimum:
21.3
1 Jan 2012 Jahr
Maximum:
56.5
1 Jan 1995 Jahr
Zum Datum der Beobachtung
Wert
Absolute Veränderung
Die Veränderung bezüglich dem vorherigen Wert
1 Jan 1992 Jahr
54.3
+54.3
0.0%
1 Jan 1993 Jahr
52.6
-1.7
-3.13%
1 Jan 1994 Jahr
49.7
-2.9
-5.51%
1 Jan 1995 Jahr
56.5
+6.8
13.68%
1 Jan 1996 Jahr
55.9
-0.6
-1.06%
1 Jan 1997 Jahr
55.7
-0.2
-0.36%
1 Jan 1998 Jahr
53.7
-2.0
-3.59%
1 Jan 1999 Jahr
54.7
+1.0
1.86%
1 Jan 2000 Jahr
51.4
-3.3
-6.03%
1 Jan 2001 Jahr
51.5
+0.1
0.19%
1 Jan 2002 Jahr
49.7
-1.8
-3.5%
1 Jan 2003 Jahr
46.0
-3.7
-7.44%
1 Jan 2004 Jahr
42.5
-3.5
-7.61%
1 Jan 2005 Jahr
42.1
-0.4
-0.94%
1 Jan 2006 Jahr
40.3
-1.8
-4.28%
1 Jan 2007 Jahr
37.3
-3.0
-7.44%
1 Jan 2011 Jahr
25.4
-11.9
-31.9%
1 Jan 2012 Jahr
21.3
-4.1
-16.14%
1 Jan 2013 Jahr
39.7
+18.4
86.38%
1 Jan 2014 Jahr
39.3
-0.4
-1.01%
1 Jan 2015 Jahr
40.7
+1.4
3.56%
Bewertung der Länder gemäß mit laufender Statistik nach Jahren


Kommentare: