29
/de/
de
AIzaSyAYiBZKx7MnpbEhh9jyipgxe19OcubqV5w
April 1, 2024
64061
Afghanistan
AFG
true
2
1
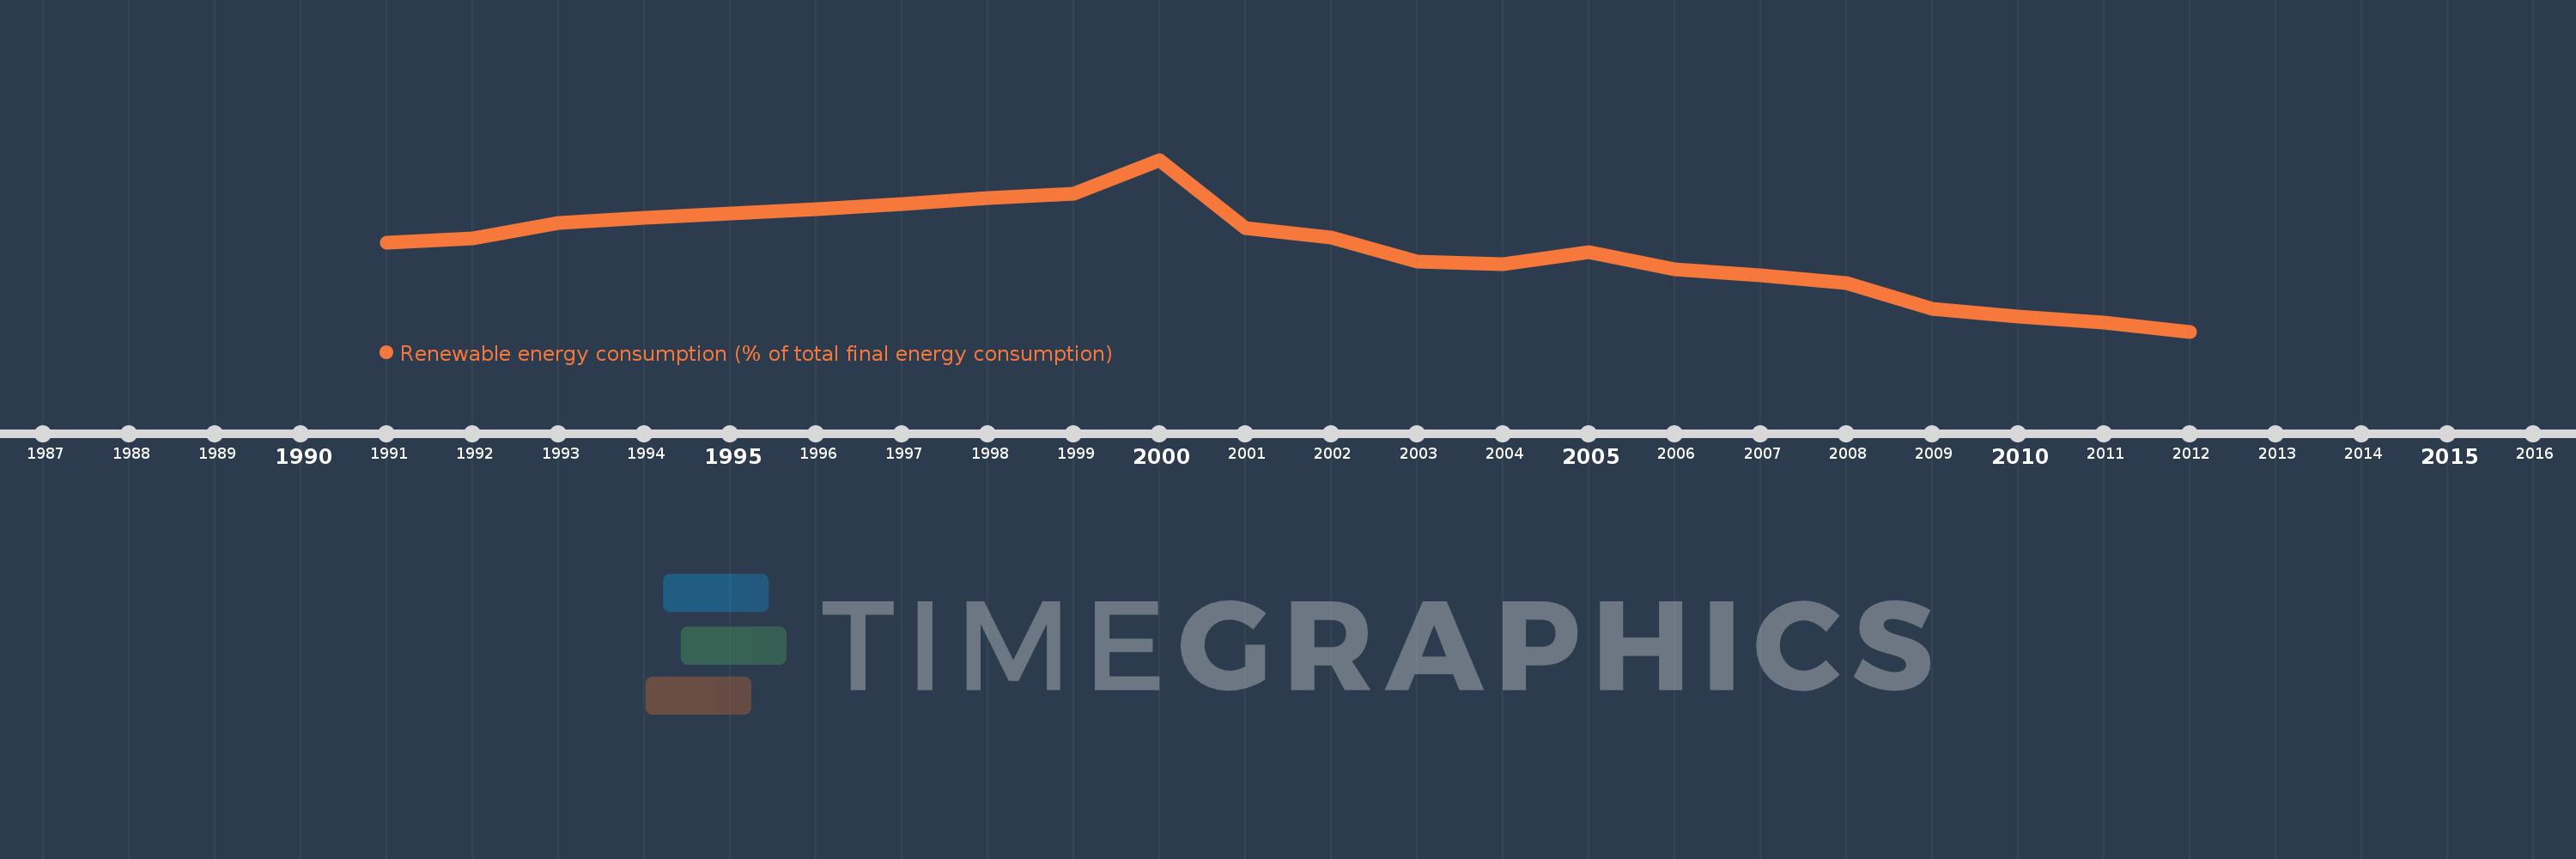
Renewable energy consumption (% of total final energy consumption)
2012,2011,2010,2009,2008,2007,2006,2005,2004,2003,2002,2001,2000,1999,1998,1997,1996,1995,1994,1993,1992,1991
Diese Statistik in anderen Ländern:
AfghanistanAlbaniaAlgeriaAngolaArab WorldArgentinaArmeniaArubaAustraliaAustriaAzerbaijanBahamas, TheBangladeshBarbadosBelarusBelgiumBelizeBeninBhutanBoliviaBosnia and HerzegovinaBotswanaBrazilBritish Virgin IslandsBrunei DarussalamBulgariaBurkina FasoBurundiCabo VerdeCambodiaCameroonCanadaCaribbean small statesCentral African RepublicCentral Europe and the BalticsChadChileChinaColombiaComorosCongo, Dem. Rep.Congo, Rep.Costa RicaCote d'IvoireCroatiaCubaCyprusCzech RepublicDenmarkDjiboutiDominicaDominican RepublicEarly-demographic dividendEast Asia & PacificEast Asia & Pacific (excluding high income)East Asia & Pacific (IDA & IBRD countries)EcuadorEgypt, Arab Rep.El SalvadorEquatorial GuineaEritreaEstoniaEthiopiaEuro areaEurope & Central AsiaEurope & Central Asia (excluding high income)Europe & Central Asia (IDA & IBRD countries)European UnionFijiFinlandFragile and conflict affected situationsFranceFrench PolynesiaGabonGambia, TheGeorgiaGermanyGhanaGreeceGrenadaGuatemalaGuineaGuinea-BissauGuyanaHaitiHeavily indebted poor countries (HIPC)High incomeHondurasHong Kong SAR, ChinaHungaryIBRD onlyIcelandIDA & IBRD totalIDA blendIDA onlyIDA totalIndiaIndonesiaIran, Islamic Rep.IraqIrelandIsraelItalyJamaicaJapanJordanKazakhstanKenyaKiribatiKorea, Dem. People’s Rep.Korea, Rep.KosovoKuwaitKyrgyz RepublicLao PDRLate-demographic dividendLatin America & Caribbean Latin America & Caribbean (excluding high income)Latin America & the Caribbean (IDA & IBRD countries)LatviaLeast developed countries: UN classificationLebanonLesothoLiberiaLibyaLithuaniaLow & middle incomeLow incomeLower middle incomeLuxembourgMacao SAR, ChinaMacedonia, FYRMadagascarMalawiMalaysiaMaldivesMaliMaltaMauritaniaMauritiusMexicoMiddle East & North AfricaMiddle East & North Africa (excluding high income)Middle East & North Africa (IDA & IBRD countries)Middle incomeMoldovaMongoliaMontenegroMoroccoMozambiqueMyanmarNamibiaNepalNetherlandsNew CaledoniaNew ZealandNicaraguaNigerNigeriaNorth AmericaNorwayOECD membersOther small statesPacific island small statesPakistanPalauPanamaPapua New GuineaParaguayPeruPhilippinesPolandPortugalPost-demographic dividendPre-demographic dividendPuerto RicoRomaniaRussian FederationRwandaSamoaSao Tome and PrincipeSaudi ArabiaSenegalSerbiaSeychellesSierra LeoneSingaporeSlovak RepublicSloveniaSmall statesSolomon IslandsSomaliaSouth AfricaSouth AsiaSouth Asia (IDA & IBRD)SpainSri LankaSt. Kitts and NevisSt. LuciaSt. Vincent and the GrenadinesSub-Saharan Africa Sub-Saharan Africa (excluding high income)Sub-Saharan Africa (IDA & IBRD countries)SudanSurinameSwazilandSwedenSwitzerlandSyrian Arab RepublicTajikistanTanzaniaThailandTimor-LesteTogoTongaTrinidad and TobagoTunisiaTurkeyTurkmenistanTurks and Caicos IslandsUgandaUkraineUnited Arab EmiratesUnited KingdomUnited StatesUpper middle incomeUruguayUzbekistanVanuatuVenezuela, RBVietnamWorldYemen, Rep.ZambiaZimbabwe Zeitlinie:
Diese Zeitleiste vorliegt die Graphik ab 1991 J. bis 2012 J. Afghanistan. Die Angaben bis 1990 J. sind nicht vorhanden. Die Zahl aktueller Beobachtungen nach Daten: 22.
Die Quelle (Bezeichnung):
Kennzahlen der Weltentwicklung
Die Quelle (Einrichtung):
© OECD/IEA and World Bank, based on IEA data in IEA World Energy Balances © OECD/IEA 2013 edition, subject to https://www.iea.org/t&c/termsandconditions/
Kategorien:
Energy & Mining, Climate Change, Environment
Es wurde aktualisiert:
23 Apr 2017 Jahr
Kennzahlen der Wertänderungen vom Jahr zum Jahr
Minimum:
10.808
1 Jan 2012 Jahr
Maximum:
92.007
1 Jan 2000 Jahr
Zum Datum der Beobachtung
Wert
Absolute Veränderung
Die Veränderung bezüglich dem vorherigen Wert
1 Jan 1991 Jahr
52.954
+52.954
0.0%
1 Jan 1992 Jahr
55.027
+2.073
3.91%
1 Jan 1993 Jahr
62.241
+7.215
13.11%
1 Jan 1994 Jahr
64.689
+2.448
3.93%
1 Jan 1995 Jahr
66.777
+2.087
3.23%
1 Jan 1996 Jahr
68.573
+1.796
2.69%
1 Jan 1997 Jahr
71.231
+2.659
3.88%
1 Jan 1998 Jahr
73.922
+2.69
3.78%
1 Jan 1999 Jahr
75.939
+2.018
2.73%
1 Jan 2000 Jahr
92.007
+16.068
21.16%
1 Jan 2001 Jahr
59.53
-32.478
-35.3%
1 Jan 2002 Jahr
55.159
-4.371
-7.34%
1 Jan 2003 Jahr
43.973
-11.186
-20.28%
1 Jan 2004 Jahr
42.668
-1.305
-2.97%
1 Jan 2005 Jahr
48.302
+5.634
13.2%
1 Jan 2006 Jahr
40.252
-8.05
-16.67%
1 Jan 2007 Jahr
37.264
-2.989
-7.43%
1 Jan 2008 Jahr
33.757
-3.507
-9.41%
1 Jan 2009 Jahr
21.392
-12.365
-36.63%
1 Jan 2010 Jahr
17.964
-3.428
-16.03%
1 Jan 2011 Jahr
15.172
-2.793
-15.55%
1 Jan 2012 Jahr
10.808
-4.364
-28.76%
Bewertung der Länder gemäß mit laufender Statistik nach Jahren


Kommentare: