29
/de/
de
AIzaSyAYiBZKx7MnpbEhh9jyipgxe19OcubqV5w
April 1, 2024
62555
World
WLD
false
2
1
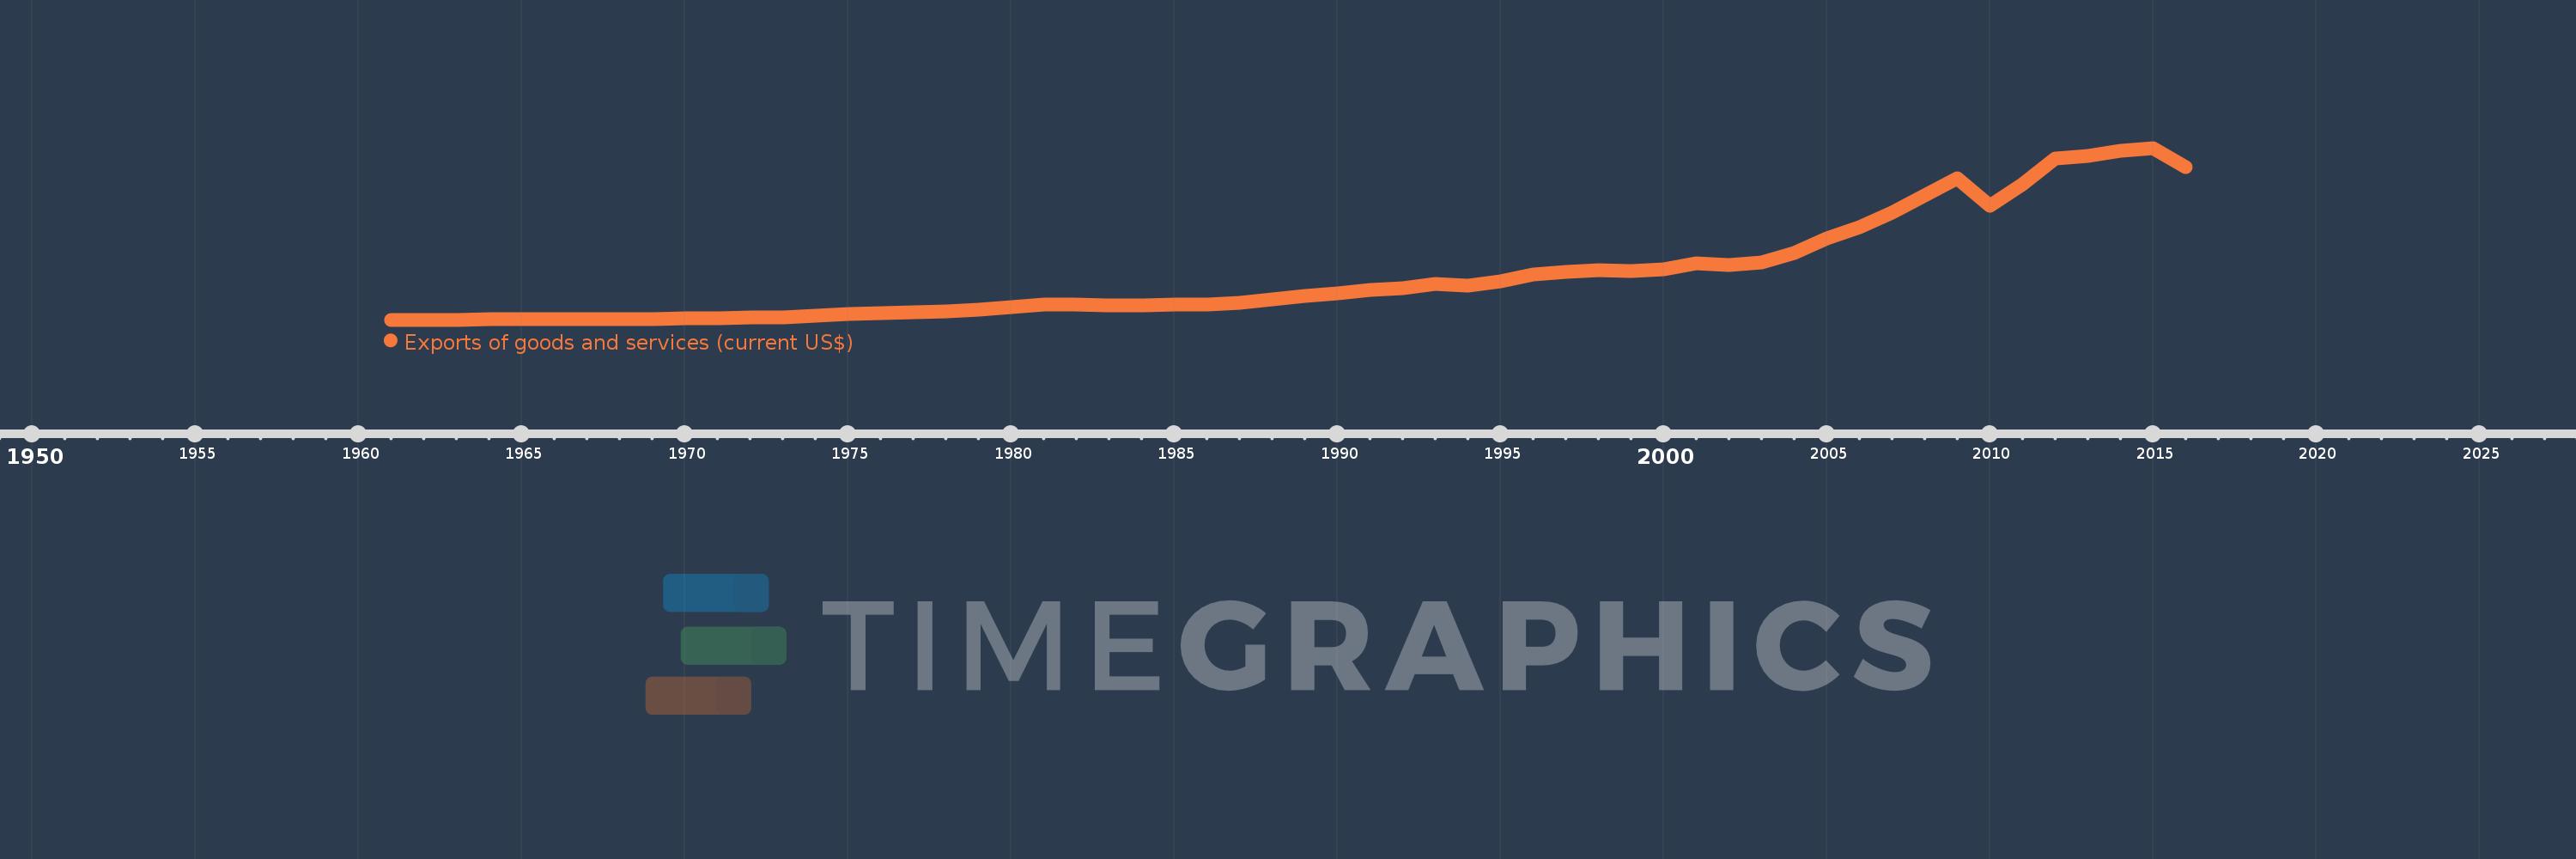
Exports of goods and services (current US$)
2016,2015,2014,2013,2012,2011,2010,2009,2008,2007,2006,2005,2004,2003,2002,2001,2000,1999,1998,1997,1996,1995,1994,1993,1992,1991,1990,1989,1988,1987,1986,1985,1984,1983,1982,1981,1980,1979,1978,1977,1976,1975,1974,1973,1972,1971,1970,1969,1968,1967,1966,1965,1964,1963,1962,1961
Diese Statistik in anderen Ländern:
AfghanistanAlbaniaAlgeriaAngolaAntigua and BarbudaArab WorldArgentinaArmeniaArubaAustraliaAustriaAzerbaijanBahamas, TheBahrainBangladeshBarbadosBelarusBelgiumBelizeBeninBermudaBhutanBoliviaBosnia and HerzegovinaBotswanaBrazilBrunei DarussalamBulgariaBurkina FasoBurundiCabo VerdeCambodiaCameroonCanadaCaribbean small statesCentral African RepublicCentral Europe and the BalticsChadChileChinaColombiaComorosCongo, Dem. Rep.Congo, Rep.Costa RicaCote d'IvoireCroatiaCubaCyprusCzech RepublicDenmarkDjiboutiDominicaDominican RepublicEarly-demographic dividendEast Asia & PacificEast Asia & Pacific (excluding high income)East Asia & Pacific (IDA & IBRD countries)EcuadorEgypt, Arab Rep.El SalvadorEquatorial GuineaEritreaEstoniaEthiopiaEuro areaEurope & Central AsiaEurope & Central Asia (excluding high income)Europe & Central Asia (IDA & IBRD countries)European UnionFaroe IslandsFijiFinlandFragile and conflict affected situationsFranceFrench PolynesiaGabonGambia, TheGeorgiaGermanyGhanaGreeceGrenadaGuatemalaGuineaGuinea-BissauGuyanaHaitiHeavily indebted poor countries (HIPC)High incomeHondurasHong Kong SAR, ChinaHungaryIBRD onlyIcelandIDA & IBRD totalIDA blendIDA onlyIDA totalIndiaIndonesiaIran, Islamic Rep.IraqIrelandIsraelItalyJamaicaJapanJordanKazakhstanKenyaKiribatiKorea, Rep.KosovoKuwaitKyrgyz RepublicLao PDRLate-demographic dividendLatin America & Caribbean Latin America & Caribbean (excluding high income)Latin America & the Caribbean (IDA & IBRD countries)LatviaLeast developed countries: UN classificationLebanonLesothoLiberiaLibyaLithuaniaLow & middle incomeLow incomeLower middle incomeLuxembourgMacao SAR, ChinaMacedonia, FYRMadagascarMalawiMalaysiaMaldivesMaliMaltaMauritaniaMauritiusMexicoMicronesia, Fed. Sts.Middle East & North AfricaMiddle East & North Africa (excluding high income)Middle East & North Africa (IDA & IBRD countries)Middle incomeMoldovaMongoliaMontenegroMoroccoMozambiqueMyanmarNamibiaNepalNetherlandsNew CaledoniaNew ZealandNicaraguaNigerNigeriaNorth AmericaNorwayOECD membersOmanOther small statesPacific island small statesPakistanPalauPanamaPapua New GuineaParaguayPeruPhilippinesPolandPortugalPost-demographic dividendPre-demographic dividendPuerto RicoQatarRomaniaRussian FederationRwandaSamoaSaudi ArabiaSenegalSerbiaSeychellesSierra LeoneSingaporeSlovak RepublicSloveniaSmall statesSolomon IslandsSomaliaSouth AfricaSouth AsiaSouth Asia (IDA & IBRD)South SudanSpainSri LankaSt. Kitts and NevisSt. LuciaSt. Vincent and the GrenadinesSub-Saharan Africa Sub-Saharan Africa (excluding high income)Sub-Saharan Africa (IDA & IBRD countries)SudanSurinameSwazilandSwedenSwitzerlandSyrian Arab RepublicTajikistanTanzaniaThailandTimor-LesteTogoTongaTrinidad and TobagoTunisiaTurkeyTurkmenistanUgandaUkraineUnited Arab EmiratesUnited KingdomUnited StatesUpper middle incomeUruguayUzbekistanVanuatuVenezuela, RBVietnamWest Bank and GazaWorldYemen, Rep.ZambiaZimbabwe Zeitlinie:
Diese Zeitleiste vorliegt die Graphik ab 1961 J. bis 2016 J. World. Die Angaben bis 1960 J. sind nicht vorhanden. Die Zahl aktueller Beobachtungen nach Daten: 56.
Die Quelle (Bezeichnung):
Kennzahlen der Weltentwicklung
Die Quelle (Einrichtung):
World Bank national accounts data, and OECD National Accounts data files.
Kategorien:
Economy & Growth, Trade
Es wurde aktualisiert:
23 Apr 2017 Jahr
Kennzahlen der Wertänderungen vom Jahr zum Jahr
im Durchschnitt:
6.327 Trln
Minimum:
155.283 Mlrd.
1 Jan 1961 Jahr
Maximum:
23.859 Trln
1 Jan 2015 Jahr
Zum Datum der Beobachtung
Wert
Absolute Veränderung
Die Veränderung bezüglich dem vorherigen Wert
1 Jan 1961 Jahr
155.283 Mlrd.
+155.283 Mlrd.
0.0%
1 Jan 1962 Jahr
161.962 Mlrd.
+6.679 Mlrd.
4.3%
1 Jan 1963 Jahr
171.282 Mlrd.
+9.32 Mlrd.
5.75%
1 Jan 1964 Jahr
185.411 Mlrd.
+14.129 Mlrd.
8.25%
1 Jan 1965 Jahr
206.976 Mlrd.
+21.565 Mlrd.
11.63%
1 Jan 1966 Jahr
224.968 Mlrd.
+17.992 Mlrd.
8.69%
1 Jan 1967 Jahr
247.293 Mlrd.
+22.324 Mlrd.
9.92%
1 Jan 1968 Jahr
262.484 Mlrd.
+15.192 Mlrd.
6.14%
1 Jan 1969 Jahr
290.854 Mlrd.
+28.37 Mlrd.
10.81%
1 Jan 1970 Jahr
328.551 Mlrd.
+37.696 Mlrd.
12.96%
1 Jan 1971 Jahr
379.509 Mlrd.
+50.958 Mlrd.
15.51%
1 Jan 1972 Jahr
425.288 Mlrd.
+45.779 Mlrd.
12.06%
1 Jan 1973 Jahr
505.1 Mlrd.
+79.812 Mlrd.
18.77%
1 Jan 1974 Jahr
690.889 Mlrd.
+185.789 Mlrd.
36.78%
1 Jan 1975 Jahr
960.978 Mlrd.
+270.089 Mlrd.
39.09%
1 Jan 1976 Jahr
1.019 Trln
+58.285 Mlrd.
6.07%
1 Jan 1977 Jahr
1.138 Trln
+119.079 Mlrd.
11.68%
1 Jan 1978 Jahr
1.29 Trln
+151.46 Mlrd.
13.31%
1 Jan 1979 Jahr
1.498 Trln
+208.231 Mlrd.
16.14%
1 Jan 1980 Jahr
1.887 Trln
+389.34 Mlrd.
25.99%
1 Jan 1981 Jahr
2.286 Trln
+398.741 Mlrd.
21.13%
1 Jan 1982 Jahr
2.281 Trln
-5.358 Mlrd.
-0.23%
1 Jan 1983 Jahr
2.154 Trln
-126.535 Mlrd.
-5.55%
1 Jan 1984 Jahr
2.124 Trln
-30.696 Mlrd.
-1.42%
1 Jan 1985 Jahr
2.241 Trln
+117.523 Mlrd.
5.53%
1 Jan 1986 Jahr
2.276 Trln
+35.018 Mlrd.
1.56%
1 Jan 1987 Jahr
2.537 Trln
+260.931 Mlrd.
11.46%
1 Jan 1988 Jahr
3.011 Trln
+473.72 Mlrd.
18.67%
1 Jan 1989 Jahr
3.464 Trln
+453.281 Mlrd.
15.06%
1 Jan 1990 Jahr
3.751 Trln
+286.965 Mlrd.
8.28%
1 Jan 1991 Jahr
4.295 Trln
+543.852 Mlrd.
14.5%
1 Jan 1992 Jahr
4.492 Trln
+196.787 Mlrd.
4.58%
1 Jan 1993 Jahr
5.064 Trln
+572.332 Mlrd.
12.74%
1 Jan 1994 Jahr
4.918 Trln
-146.132 Mlrd.
-2.89%
1 Jan 1995 Jahr
5.434 Trln
+516.143 Mlrd.
10.5%
1 Jan 1996 Jahr
6.445 Trln
+1.011 Trln
18.6%
1 Jan 1997 Jahr
6.746 Trln
+301.216 Mlrd.
4.67%
1 Jan 1998 Jahr
6.979 Trln
+233.454 Mlrd.
3.46%
1 Jan 1999 Jahr
6.902 Trln
-77.359 Mlrd.
-1.11%
1 Jan 2000 Jahr
7.156 Trln
+254.266 Mlrd.
3.68%
1 Jan 2001 Jahr
7.931 Trln
+774.779 Mlrd.
10.83%
1 Jan 2002 Jahr
7.689 Trln
-242.379 Mlrd.
-3.06%
1 Jan 2003 Jahr
8.068 Trln
+379.459 Mlrd.
4.94%
1 Jan 2004 Jahr
9.368 Trln
+1.3 Trln
16.12%
1 Jan 2005 Jahr
11.364 Trln
+1.995 Trln
21.3%
1 Jan 2006 Jahr
12.918 Trln
+1.554 Trln
13.67%
1 Jan 2007 Jahr
14.887 Trln
+1.969 Trln
15.25%
1 Jan 2008 Jahr
17.298 Trln
+2.411 Trln
16.2%
1 Jan 2009 Jahr
19.684 Trln
+2.385 Trln
13.79%
1 Jan 2010 Jahr
15.858 Trln
-3.825 Trln
-19.43%
1 Jan 2011 Jahr
18.903 Trln
+3.045 Trln
19.2%
1 Jan 2012 Jahr
22.431 Trln
+3.528 Trln
18.67%
1 Jan 2013 Jahr
22.763 Trln
+331.372 Mlrd.
1.48%
1 Jan 2014 Jahr
23.423 Trln
+660.095 Mlrd.
2.9%
1 Jan 2015 Jahr
23.859 Trln
+436.519 Mlrd.
1.86%
1 Jan 2016 Jahr
21.27 Trln
-2.59 Trln
-10.85%
Bewertung der Länder gemäß mit laufender Statistik nach Jahren


Kommentare: