29
/de/
de
AIzaSyAYiBZKx7MnpbEhh9jyipgxe19OcubqV5w
April 1, 2024
60631
Sub-Saharan Africa (IDA & IBRD countries)
TSS
false
2
1
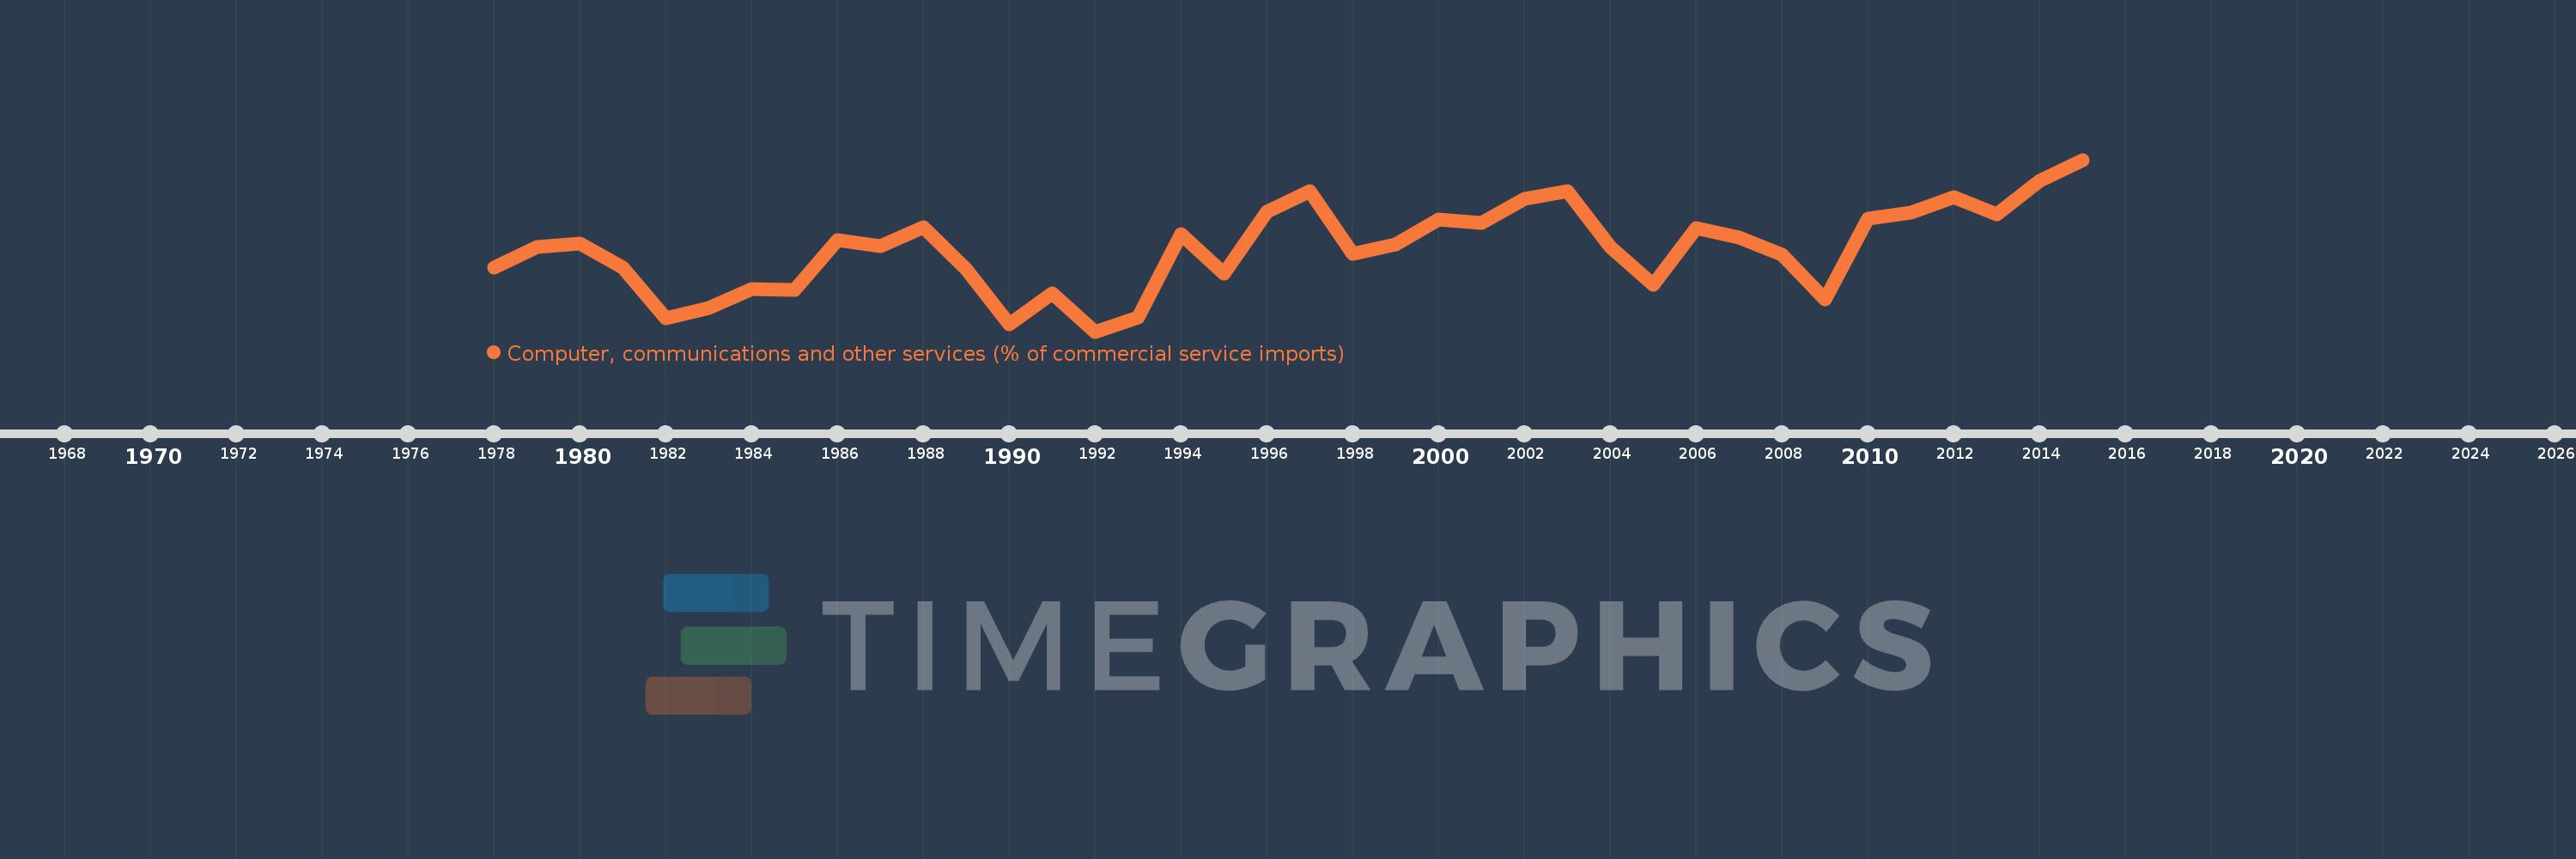
Computer, communications and other services (% of commercial service imports)
2015,2014,2013,2012,2011,2010,2009,2008,2007,2006,2005,2004,2003,2002,2001,2000,1999,1998,1997,1996,1995,1994,1993,1992,1991,1990,1989,1988,1987,1986,1985,1984,1983,1982,1981,1980,1979,1978
Diese Statistik in anderen Ländern:
AfghanistanAlbaniaAlgeriaAngolaAntigua and BarbudaArab WorldArgentinaArmeniaArubaAustraliaAustriaAzerbaijanBahamas, TheBahrainBangladeshBarbadosBelarusBelgiumBelizeBeninBermudaBhutanBoliviaBosnia and HerzegovinaBotswanaBrazilBrunei DarussalamBulgariaBurkina FasoBurundiCabo VerdeCambodiaCameroonCanadaCaribbean small statesCentral African RepublicCentral Europe and the BalticsChadChileChinaColombiaComorosCongo, Dem. Rep.Congo, Rep.Costa RicaCote d'IvoireCroatiaCuracaoCyprusCzech RepublicDenmarkDjiboutiDominicaDominican RepublicEarly-demographic dividendEast Asia & PacificEast Asia & Pacific (excluding high income)East Asia & Pacific (IDA & IBRD countries)EcuadorEgypt, Arab Rep.El SalvadorEquatorial GuineaEritreaEstoniaEthiopiaEuro areaEurope & Central AsiaEurope & Central Asia (excluding high income)Europe & Central Asia (IDA & IBRD countries)European UnionFaroe IslandsFijiFinlandFragile and conflict affected situationsFranceFrench PolynesiaGabonGambia, TheGeorgiaGermanyGhanaGreeceGrenadaGuatemalaGuineaGuinea-BissauGuyanaHaitiHeavily indebted poor countries (HIPC)High incomeHondurasHong Kong SAR, ChinaHungaryIBRD onlyIcelandIDA & IBRD totalIDA onlyIDA totalIndiaIndonesiaIran, Islamic Rep.IraqIrelandIsraelItalyJamaicaJapanJordanKazakhstanKenyaKiribatiKorea, Rep.KosovoKuwaitKyrgyz RepublicLao PDRLate-demographic dividendLatin America & Caribbean Latin America & Caribbean (excluding high income)Latin America & the Caribbean (IDA & IBRD countries)LatviaLeast developed countries: UN classificationLebanonLesothoLiberiaLibyaLithuaniaLow & middle incomeLow incomeLower middle incomeLuxembourgMacao SAR, ChinaMacedonia, FYRMadagascarMalawiMalaysiaMaldivesMaliMaltaMarshall IslandsMauritaniaMauritiusMexicoMicronesia, Fed. Sts.Middle East & North AfricaMiddle East & North Africa (excluding high income)Middle East & North Africa (IDA & IBRD countries)Middle incomeMoldovaMongoliaMontenegroMoroccoMozambiqueMyanmarNamibiaNepalNetherlandsNew CaledoniaNew ZealandNicaraguaNigerNigeriaNorth AmericaNorwayOECD membersOmanOther small statesPacific island small statesPakistanPalauPanamaPapua New GuineaParaguayPeruPhilippinesPolandPortugalPost-demographic dividendPre-demographic dividendQatarRomaniaRussian FederationRwandaSamoaSao Tome and PrincipeSaudi ArabiaSenegalSerbiaSeychellesSierra LeoneSingaporeSint Maarten (Dutch part)Slovak RepublicSloveniaSmall statesSolomon IslandsSouth AfricaSouth AsiaSouth Asia (IDA & IBRD)South SudanSpainSri LankaSt. Kitts and NevisSt. LuciaSt. Vincent and the GrenadinesSub-Saharan Africa Sub-Saharan Africa (excluding high income)Sub-Saharan Africa (IDA & IBRD countries)SudanSurinameSwazilandSwedenSwitzerlandSyrian Arab RepublicTajikistanTanzaniaThailandTimor-LesteTogoTongaTrinidad and TobagoTunisiaTurkeyTuvaluUgandaUkraineUnited KingdomUnited StatesUpper middle incomeUruguayVanuatuVenezuela, RBWest Bank and GazaWorldYemen, Rep.ZambiaZimbabwe Zeitlinie:
Diese Zeitleiste vorliegt die Graphik ab 1978 J. bis 2015 J. Sub-Saharan Africa (IDA & IBRD countries). Die Angaben bis 1977 J. sind nicht vorhanden. Die Zahl aktueller Beobachtungen nach Daten: 38.
Die Quelle (Bezeichnung):
Kennzahlen der Weltentwicklung
Die Quelle (Einrichtung):
International Monetary Fund, Balance of Payments Statistics Yearbook and data files.
Kategorien:
Private Sector, Trade
Es wurde aktualisiert:
23 Apr 2017 Jahr
Kennzahlen der Wertänderungen vom Jahr zum Jahr
Minimum:
22.939
1 Jan 1992 Jahr
Maximum:
33.865
1 Jan 2015 Jahr
Zum Datum der Beobachtung
Wert
Absolute Veränderung
Die Veränderung bezüglich dem vorherigen Wert
1 Jan 1978 Jahr
27.002
+27.002
0.0%
1 Jan 1979 Jahr
28.345
+1.343
4.97%
1 Jan 1980 Jahr
28.524
+0.179
0.63%
1 Jan 1981 Jahr
27.001
-1.523
-5.34%
1 Jan 1982 Jahr
23.803
-3.198
-11.84%
1 Jan 1983 Jahr
24.46
+0.657
2.76%
1 Jan 1984 Jahr
25.663
+1.203
4.92%
1 Jan 1985 Jahr
25.568
-0.095
-0.37%
1 Jan 1986 Jahr
28.752
+3.185
12.46%
1 Jan 1987 Jahr
28.389
-0.364
-1.26%
1 Jan 1988 Jahr
29.594
+1.205
4.24%
1 Jan 1989 Jahr
26.925
-2.669
-9.02%
1 Jan 1990 Jahr
23.43
-3.495
-12.98%
1 Jan 1991 Jahr
25.351
+1.921
8.2%
1 Jan 1992 Jahr
22.939
-2.412
-9.51%
1 Jan 1993 Jahr
23.863
+0.924
4.03%
1 Jan 1994 Jahr
29.159
+5.296
22.19%
1 Jan 1995 Jahr
26.627
-2.531
-8.68%
1 Jan 1996 Jahr
30.561
+3.934
14.77%
1 Jan 1997 Jahr
31.898
+1.337
4.37%
1 Jan 1998 Jahr
27.877
-4.021
-12.6%
1 Jan 1999 Jahr
28.481
+0.604
2.17%
1 Jan 2000 Jahr
30.042
+1.561
5.48%
1 Jan 2001 Jahr
29.835
-0.207
-0.69%
1 Jan 2002 Jahr
31.358
+1.522
5.1%
1 Jan 2003 Jahr
31.862
+0.504
1.61%
1 Jan 2004 Jahr
28.303
-3.558
-11.17%
1 Jan 2005 Jahr
25.94
-2.363
-8.35%
1 Jan 2006 Jahr
29.525
+3.584
13.82%
1 Jan 2007 Jahr
28.912
-0.613
-2.08%
1 Jan 2008 Jahr
27.821
-1.091
-3.77%
1 Jan 2009 Jahr
24.999
-2.822
-10.14%
1 Jan 2010 Jahr
30.137
+5.138
20.55%
1 Jan 2011 Jahr
30.52
+0.383
1.27%
1 Jan 2012 Jahr
31.481
+0.96
3.15%
1 Jan 2013 Jahr
30.39
-1.091
-3.47%
1 Jan 2014 Jahr
32.525
+2.136
7.03%
1 Jan 2015 Jahr
33.865
+1.34
4.12%
Bewertung der Länder gemäß mit laufender Statistik nach Jahren


Kommentare: