29
/de/
de
AIzaSyAYiBZKx7MnpbEhh9jyipgxe19OcubqV5w
April 1, 2024
59534
Sub-Saharan Africa (excluding high income)
SSA
false
2
1
Arable land (hectares per person)
2015,2014,2013,2012,2011,2010,2009,2008,2007,2006,2005,2004,2003,2002,2001,2000,1999,1998,1997,1996,1995,1994,1993,1992,1991,1990,1989,1988,1987,1986,1985,1984,1983,1982,1981,1980,1979,1978,1977,1976,1975,1974,1973,1972,1971,1970,1969,1968,1967,1966,1965,1964,1963,1962
Diese Statistik in anderen Ländern:
AfghanistanAlbaniaAlgeriaAmerican SamoaAndorraAngolaAntigua and BarbudaArab WorldArgentinaArmeniaArubaAustraliaAustriaAzerbaijanBahamas, TheBahrainBangladeshBarbadosBelarusBelgiumBelizeBeninBermudaBhutanBoliviaBosnia and HerzegovinaBotswanaBrazilBritish Virgin IslandsBrunei DarussalamBulgariaBurkina FasoBurundiCabo VerdeCambodiaCameroonCanadaCaribbean small statesCayman IslandsCentral African RepublicCentral Europe and the BalticsChadChannel IslandsChileChinaColombiaComorosCongo, Dem. Rep.Congo, Rep.Costa RicaCote d'IvoireCroatiaCubaCyprusCzech RepublicDenmarkDjiboutiDominicaDominican RepublicEarly-demographic dividendEast Asia & PacificEast Asia & Pacific (excluding high income)East Asia & Pacific (IDA & IBRD countries)EcuadorEgypt, Arab Rep.El SalvadorEquatorial GuineaEritreaEstoniaEthiopiaEuro areaEurope & Central AsiaEurope & Central Asia (excluding high income)Europe & Central Asia (IDA & IBRD countries)European UnionFaroe IslandsFijiFinlandFragile and conflict affected situationsFranceFrench PolynesiaGabonGambia, TheGeorgiaGermanyGhanaGreeceGreenlandGrenadaGuamGuatemalaGuineaGuinea-BissauGuyanaHaitiHeavily indebted poor countries (HIPC)High incomeHondurasHong Kong SAR, ChinaHungaryIBRD onlyIcelandIDA & IBRD totalIDA blendIDA onlyIDA totalIndiaIndonesiaIran, Islamic Rep.IraqIrelandIsle of ManIsraelItalyJamaicaJapanJordanKazakhstanKenyaKiribatiKorea, Dem. People’s Rep.Korea, Rep.KosovoKuwaitKyrgyz RepublicLao PDRLate-demographic dividendLatin America & Caribbean Latin America & Caribbean (excluding high income)Latin America & the Caribbean (IDA & IBRD countries)LatviaLeast developed countries: UN classificationLebanonLesothoLiberiaLibyaLiechtensteinLithuaniaLow & middle incomeLow incomeLower middle incomeLuxembourgMacedonia, FYRMadagascarMalawiMalaysiaMaldivesMaliMaltaMarshall IslandsMauritaniaMauritiusMexicoMicronesia, Fed. Sts.Middle East & North AfricaMiddle East & North Africa (excluding high income)Middle East & North Africa (IDA & IBRD countries)Middle incomeMoldovaMongoliaMontenegroMoroccoMozambiqueMyanmarNamibiaNepalNetherlandsNew CaledoniaNew ZealandNicaraguaNigerNigeriaNorth AmericaNorthern Mariana IslandsNorwayOECD membersOmanOther small statesPacific island small statesPakistanPalauPanamaPapua New GuineaParaguayPeruPhilippinesPolandPortugalPost-demographic dividendPre-demographic dividendPuerto RicoQatarRomaniaRussian FederationRwandaSamoaSan MarinoSao Tome and PrincipeSaudi ArabiaSenegalSerbiaSeychellesSierra LeoneSingaporeSlovak RepublicSloveniaSmall statesSolomon IslandsSomaliaSouth AfricaSouth AsiaSouth Asia (IDA & IBRD)SpainSri LankaSt. Kitts and NevisSt. LuciaSt. Vincent and the GrenadinesSub-Saharan Africa Sub-Saharan Africa (excluding high income)Sub-Saharan Africa (IDA & IBRD countries)SudanSurinameSwazilandSwedenSwitzerlandSyrian Arab RepublicTajikistanTanzaniaThailandTimor-LesteTogoTongaTrinidad and TobagoTunisiaTurkeyTurkmenistanTurks and Caicos IslandsUgandaUkraineUnited Arab EmiratesUnited KingdomUnited StatesUpper middle incomeUruguayUzbekistanVanuatuVenezuela, RBVietnamVirgin Islands (U.S.)West Bank and GazaWorldYemen, Rep.ZambiaZimbabwe Zeitlinie:
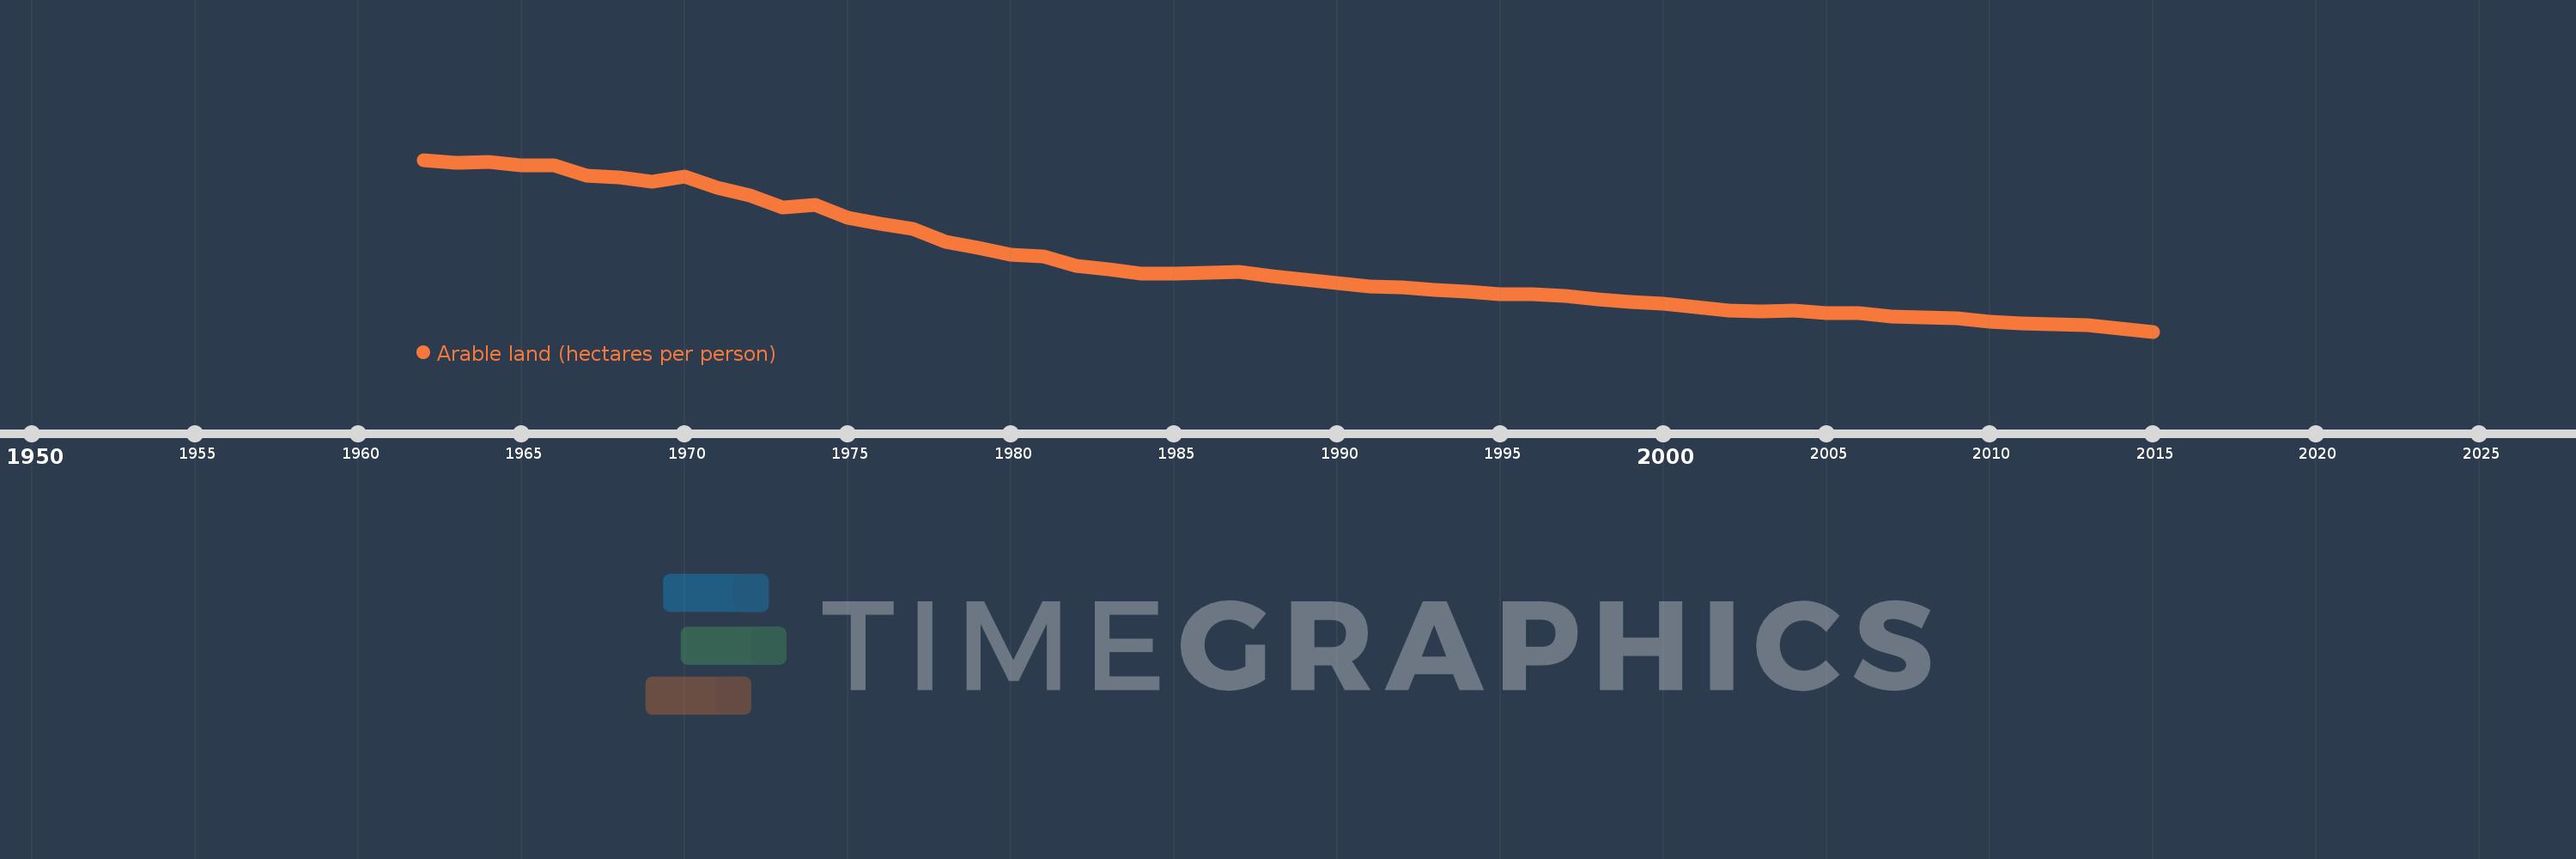
Diese Zeitleiste vorliegt die Graphik ab 1962 J. bis 2015 J. Sub-Saharan Africa (excluding high income). Die Angaben bis 1961 J. sind nicht vorhanden. Die Zahl aktueller Beobachtungen nach Daten: 54.
Die Quelle (Bezeichnung):
Kennzahlen der Weltentwicklung
Die Quelle (Einrichtung):
Food and Agriculture Organization, electronic files and web site.
Kategorien:
Agriculture & Rural Development
Es wurde aktualisiert:
23 Apr 2017 Jahr
Kennzahlen der Wertänderungen vom Jahr zum Jahr
Minimum:
0.219
1 Jan 2015 Jahr
Maximum:
0.575
1 Jan 1962 Jahr
Zum Datum der Beobachtung
Wert
Absolute Veränderung
Die Veränderung bezüglich dem vorherigen Wert
1 Jan 1962 Jahr
0.575
+0.575
0.0%
1 Jan 1963 Jahr
0.568
-0.007
-1.17%
1 Jan 1964 Jahr
0.571
+0.003
0.51%
1 Jan 1965 Jahr
0.564
-0.007
-1.14%
1 Jan 1966 Jahr
0.563
-0.002
-0.28%
1 Jan 1967 Jahr
0.542
-0.021
-3.78%
1 Jan 1968 Jahr
0.538
-0.003
-0.62%
1 Jan 1969 Jahr
0.53
-0.008
-1.47%
1 Jan 1970 Jahr
0.54
+0.009
1.78%
1 Jan 1971 Jahr
0.517
-0.023
-4.2%
1 Jan 1972 Jahr
0.502
-0.015
-2.98%
1 Jan 1973 Jahr
0.477
-0.025
-4.91%
1 Jan 1974 Jahr
0.481
+0.004
0.85%
1 Jan 1975 Jahr
0.454
-0.027
-5.63%
1 Jan 1976 Jahr
0.442
-0.012
-2.63%
1 Jan 1977 Jahr
0.432
-0.01
-2.19%
1 Jan 1978 Jahr
0.405
-0.028
-6.36%
1 Jan 1979 Jahr
0.393
-0.012
-3.04%
1 Jan 1980 Jahr
0.379
-0.014
-3.47%
1 Jan 1981 Jahr
0.374
-0.005
-1.32%
1 Jan 1982 Jahr
0.355
-0.019
-5.18%
1 Jan 1983 Jahr
0.348
-0.006
-1.76%
1 Jan 1984 Jahr
0.34
-0.008
-2.29%
1 Jan 1985 Jahr
0.34
0.0
-0.09%
1 Jan 1986 Jahr
0.341
+0.001
0.15%
1 Jan 1987 Jahr
0.343
+0.003
0.77%
1 Jan 1988 Jahr
0.333
-0.01
-2.81%
1 Jan 1989 Jahr
0.327
-0.007
-2.01%
1 Jan 1990 Jahr
0.319
-0.007
-2.24%
1 Jan 1991 Jahr
0.313
-0.006
-1.95%
1 Jan 1992 Jahr
0.31
-0.003
-0.89%
1 Jan 1993 Jahr
0.305
-0.006
-1.8%
1 Jan 1994 Jahr
0.301
-0.004
-1.38%
1 Jan 1995 Jahr
0.296
-0.005
-1.67%
1 Jan 1996 Jahr
0.296
+0.0
0.02%
1 Jan 1997 Jahr
0.292
-0.003
-1.13%
1 Jan 1998 Jahr
0.286
-0.006
-2.03%
1 Jan 1999 Jahr
0.28
-0.006
-2.16%
1 Jan 2000 Jahr
0.277
-0.003
-1.13%
1 Jan 2001 Jahr
0.27
-0.007
-2.67%
1 Jan 2002 Jahr
0.262
-0.008
-2.83%
1 Jan 2003 Jahr
0.26
-0.002
-0.93%
1 Jan 2004 Jahr
0.262
+0.002
0.88%
1 Jan 2005 Jahr
0.257
-0.005
-1.81%
1 Jan 2006 Jahr
0.257
-0.001
-0.26%
1 Jan 2007 Jahr
0.251
-0.006
-2.16%
1 Jan 2008 Jahr
0.248
-0.003
-1.37%
1 Jan 2009 Jahr
0.246
-0.001
-0.55%
1 Jan 2010 Jahr
0.239
-0.007
-2.96%
1 Jan 2011 Jahr
0.236
-0.003
-1.18%
1 Jan 2012 Jahr
0.234
-0.002
-0.65%
1 Jan 2013 Jahr
0.233
-0.002
-0.73%
1 Jan 2014 Jahr
0.225
-0.007
-3.2%
1 Jan 2015 Jahr
0.219
-0.006
-2.66%
Bewertung der Länder gemäß mit laufender Statistik nach Jahren


Kommentare: