29
/de/
de
AIzaSyAYiBZKx7MnpbEhh9jyipgxe19OcubqV5w
April 1, 2024
59510
Sub-Saharan Africa (excluding high income)
SSA
false
2
1
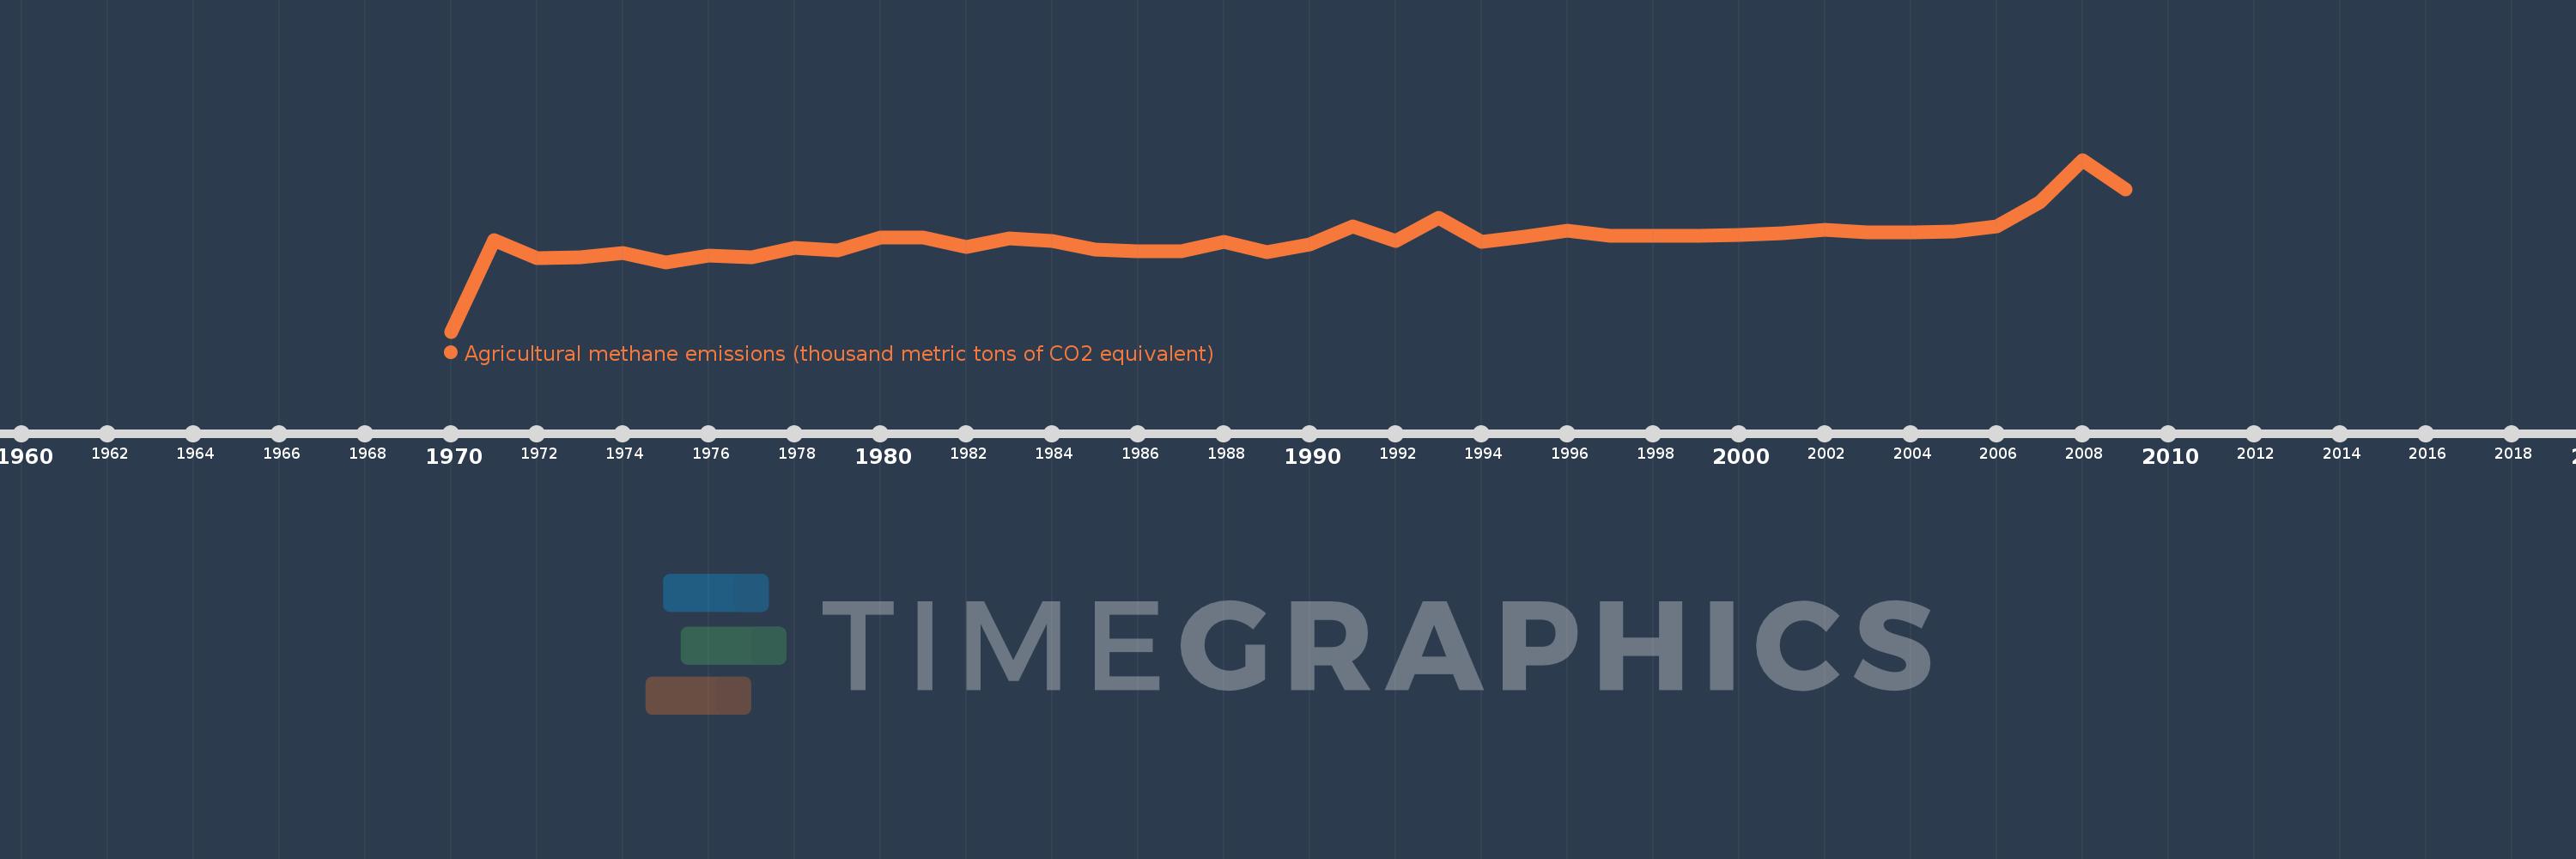
Agricultural methane emissions (thousand metric tons of CO2 equivalent)
2009,2008,2007,2006,2005,2004,2003,2002,2001,2000,1999,1998,1997,1996,1995,1994,1993,1992,1991,1990,1989,1988,1987,1986,1985,1984,1983,1982,1981,1980,1979,1978,1977,1976,1975,1974,1973,1972,1971,1970
Diese Statistik in anderen Ländern:
AfghanistanAlbaniaAlgeriaAmerican SamoaAndorraAngolaAntigua and BarbudaArab WorldArgentinaArmeniaArubaAustraliaAustriaAzerbaijanBahamas, TheBahrainBangladeshBarbadosBelarusBelgiumBelizeBeninBermudaBhutanBoliviaBosnia and HerzegovinaBotswanaBrazilBritish Virgin IslandsBrunei DarussalamBulgariaBurkina FasoBurundiCabo VerdeCambodiaCameroonCanadaCaribbean small statesCayman IslandsCentral African RepublicCentral Europe and the BalticsChadChannel IslandsChileChinaColombiaComorosCongo, Dem. Rep.Congo, Rep.Costa RicaCote d'IvoireCroatiaCubaCuracaoCyprusCzech RepublicDenmarkDjiboutiDominicaDominican RepublicEarly-demographic dividendEast Asia & PacificEast Asia & Pacific (excluding high income)East Asia & Pacific (IDA & IBRD countries)EcuadorEgypt, Arab Rep.El SalvadorEquatorial GuineaEritreaEstoniaEthiopiaEuro areaEurope & Central AsiaEurope & Central Asia (excluding high income)Europe & Central Asia (IDA & IBRD countries)European UnionFaroe IslandsFijiFinlandFragile and conflict affected situationsFranceFrench PolynesiaGabonGambia, TheGeorgiaGermanyGhanaGibraltarGreeceGreenlandGrenadaGuamGuatemalaGuineaGuinea-BissauGuyanaHaitiHeavily indebted poor countries (HIPC)High incomeHondurasHong Kong SAR, ChinaHungaryIBRD onlyIcelandIDA & IBRD totalIDA blendIDA onlyIDA totalIndiaIndonesiaIran, Islamic Rep.IraqIrelandIsle of ManIsraelItalyJamaicaJapanJordanKazakhstanKenyaKiribatiKorea, Dem. People’s Rep.Korea, Rep.KosovoKuwaitKyrgyz RepublicLao PDRLate-demographic dividendLatin America & Caribbean Latin America & Caribbean (excluding high income)Latin America & the Caribbean (IDA & IBRD countries)LatviaLeast developed countries: UN classificationLebanonLesothoLiberiaLibyaLiechtensteinLithuaniaLow & middle incomeLow incomeLower middle incomeLuxembourgMacao SAR, ChinaMacedonia, FYRMadagascarMalawiMalaysiaMaldivesMaliMaltaMarshall IslandsMauritaniaMauritiusMexicoMicronesia, Fed. Sts.Middle East & North AfricaMiddle East & North Africa (excluding high income)Middle East & North Africa (IDA & IBRD countries)Middle incomeMoldovaMonacoMongoliaMontenegroMoroccoMozambiqueMyanmarNamibiaNauruNepalNetherlandsNew CaledoniaNew ZealandNicaraguaNigerNigeriaNorth AmericaNorthern Mariana IslandsNorwayOECD membersOmanOther small statesPacific island small statesPakistanPalauPanamaPapua New GuineaParaguayPeruPhilippinesPolandPortugalPost-demographic dividendPre-demographic dividendPuerto RicoQatarRomaniaRussian FederationRwandaSamoaSan MarinoSao Tome and PrincipeSaudi ArabiaSenegalSerbiaSeychellesSierra LeoneSingaporeSint Maarten (Dutch part)Slovak RepublicSloveniaSmall statesSolomon IslandsSomaliaSouth AfricaSouth AsiaSouth Asia (IDA & IBRD)South SudanSpainSri LankaSt. Kitts and NevisSt. LuciaSt. Martin (French part)St. Vincent and the GrenadinesSub-Saharan Africa Sub-Saharan Africa (excluding high income)Sub-Saharan Africa (IDA & IBRD countries)SudanSurinameSwazilandSwedenSwitzerlandSyrian Arab RepublicTajikistanTanzaniaThailandTimor-LesteTogoTongaTrinidad and TobagoTunisiaTurkeyTurkmenistanTurks and Caicos IslandsTuvaluUgandaUkraineUnited Arab EmiratesUnited KingdomUnited StatesUpper middle incomeUruguayUzbekistanVanuatuVenezuela, RBVietnamVirgin Islands (U.S.)West Bank and GazaWorldYemen, Rep.ZambiaZimbabwe Zeitlinie:
Diese Zeitleiste vorliegt die Graphik ab 1970 J. bis 2009 J. Sub-Saharan Africa (excluding high income). Die Angaben bis 1969 J. sind nicht vorhanden. Die Zahl aktueller Beobachtungen nach Daten: 40.
Die Quelle (Bezeichnung):
Kennzahlen der Weltentwicklung
Die Quelle (Einrichtung):
European Commission, Joint Research Centre (JRC)/Netherlands Environmental Assessment Agency (PBL). Emission Database for Global Atmospheric Research (EDGAR): http://edgar.jrc.ec.europa.eu/
Kategorien:
Agriculture & Rural Development, Environment
Es wurde aktualisiert:
23 Apr 2017 Jahr
Kennzahlen der Wertänderungen vom Jahr zum Jahr
im Durchschnitt:
316.456 Tsnd.
Minimum:
0.0
1 Jan 1970 Jahr
Maximum:
589.621 Tsnd.
1 Jan 2008 Jahr
Zum Datum der Beobachtung
Wert
Absolute Veränderung
Die Veränderung bezüglich dem vorherigen Wert
1 Jan 1970 Jahr
0.0
0.0
0.0%
1 Jan 1971 Jahr
312.714 Tsnd.
+312.714 Tsnd.
%
1 Jan 1972 Jahr
251.446 Tsnd.
-61.268 Tsnd.
-19.59%
1 Jan 1973 Jahr
256.21 Tsnd.
+4.763 Tsnd.
1.89%
1 Jan 1974 Jahr
270.08 Tsnd.
+13.87 Tsnd.
5.41%
1 Jan 1975 Jahr
238.221 Tsnd.
-31.859 Tsnd.
-11.8%
1 Jan 1976 Jahr
261.743 Tsnd.
+23.522 Tsnd.
9.87%
1 Jan 1977 Jahr
256.461 Tsnd.
-5.281 Tsnd.
-2.02%
1 Jan 1978 Jahr
286.656 Tsnd.
+30.195 Tsnd.
11.77%
1 Jan 1979 Jahr
279.798 Tsnd.
-6.858 Tsnd.
-2.39%
1 Jan 1980 Jahr
322.522 Tsnd.
+42.724 Tsnd.
15.27%
1 Jan 1981 Jahr
322.248 Tsnd.
-273.806
-0.08%
1 Jan 1982 Jahr
290.504 Tsnd.
-31.745 Tsnd.
-9.85%
1 Jan 1983 Jahr
321.042 Tsnd.
+30.538 Tsnd.
10.51%
1 Jan 1984 Jahr
311.57 Tsnd.
-9.472 Tsnd.
-2.95%
1 Jan 1985 Jahr
282.381 Tsnd.
-29.189 Tsnd.
-9.37%
1 Jan 1986 Jahr
275.645 Tsnd.
-6.736 Tsnd.
-2.39%
1 Jan 1987 Jahr
275.818 Tsnd.
+173.105
0.06%
1 Jan 1988 Jahr
308.992 Tsnd.
+33.174 Tsnd.
12.03%
1 Jan 1989 Jahr
273.242 Tsnd.
-35.75 Tsnd.
-11.57%
1 Jan 1990 Jahr
298.904 Tsnd.
+25.663 Tsnd.
9.39%
1 Jan 1991 Jahr
359.675 Tsnd.
+60.771 Tsnd.
20.33%
1 Jan 1992 Jahr
311.761 Tsnd.
-47.915 Tsnd.
-13.32%
1 Jan 1993 Jahr
390.636 Tsnd.
+78.875 Tsnd.
25.3%
1 Jan 1994 Jahr
309.406 Tsnd.
-81.229 Tsnd.
-20.79%
1 Jan 1995 Jahr
327.149 Tsnd.
+17.742 Tsnd.
5.73%
1 Jan 1996 Jahr
345.417 Tsnd.
+18.269 Tsnd.
5.58%
1 Jan 1997 Jahr
329.798 Tsnd.
-15.619 Tsnd.
-4.52%
1 Jan 1998 Jahr
328.531 Tsnd.
-1.267 Tsnd.
-0.38%
1 Jan 1999 Jahr
329.002 Tsnd.
+470.768
0.14%
1 Jan 2000 Jahr
332.199 Tsnd.
+3.197 Tsnd.
0.97%
1 Jan 2001 Jahr
337.036 Tsnd.
+4.837 Tsnd.
1.46%
1 Jan 2002 Jahr
350.372 Tsnd.
+13.336 Tsnd.
3.96%
1 Jan 2003 Jahr
341.593 Tsnd.
-8.779 Tsnd.
-2.51%
1 Jan 2004 Jahr
341.101 Tsnd.
-492.557
-0.14%
1 Jan 2005 Jahr
344.568 Tsnd.
+3.467 Tsnd.
1.02%
1 Jan 2006 Jahr
361.372 Tsnd.
+16.804 Tsnd.
4.88%
1 Jan 2007 Jahr
443.784 Tsnd.
+82.412 Tsnd.
22.81%
1 Jan 2008 Jahr
589.621 Tsnd.
+145.837 Tsnd.
32.86%
1 Jan 2009 Jahr
489.023 Tsnd.
-100.599 Tsnd.
-17.06%
Bewertung der Länder gemäß mit laufender Statistik nach Jahren


Kommentare: