30
/de/
AIzaSyAYiBZKx7MnpbEhh9jyipgxe19OcubqV5w
April 1, 2024
58625
South Asia (IDA & IBRD)
TSA
false
2
1
Unemployment with primary education, female (% of female unemployment)
2011,2006,2005,2004,2003,2002,2001,2000,1999,1998,1997,1996,1995,1994,1993,1992
Download
Bibliothek der Globalstatistik →South Asia (IDA & IBRD) →

Unemployment with primary education, female (% of female unemployment)

Diese Statistik in anderen Ländern:

AlbaniaAlgeriaArgentinaArmeniaArubaAustraliaAustriaAzerbaijanBahamas, TheBahrainBangladeshBarbadosBelarusBelgiumBelizeBermudaBhutanBoliviaBosnia and HerzegovinaBotswanaBrazilBritish Virgin IslandsBrunei DarussalamBulgariaBurkina FasoCanadaCaribbean small statesCayman IslandsCentral African RepublicCentral Europe and the BalticsChileColombiaCosta RicaCroatiaCubaCyprusCzech RepublicDenmarkDominicaDominican RepublicEarly-demographic dividendEcuadorEgypt, Arab Rep.El SalvadorEstoniaEthiopiaEuro areaEurope & Central AsiaEurope & Central Asia (excluding high income)Europe & Central Asia (IDA & IBRD countries)European UnionFijiFinlandFranceGabonGeorgiaGermanyGreeceGuatemalaHigh incomeHondurasHong Kong SAR, ChinaHungaryIcelandIndiaIndonesiaIran, Islamic Rep.IrelandIsraelItalyJamaicaJapanJordanKazakhstanKorea, Rep.KosovoKuwaitKyrgyz RepublicLatin America & Caribbean Latin America & Caribbean (excluding high income)Latin America & the Caribbean (IDA & IBRD countries)LatviaLebanonLesothoLithuaniaLower middle incomeLuxembourgMacao SAR, ChinaMacedonia, FYRMadagascarMalaysiaMaltaMauritiusMexicoMiddle East & North AfricaMiddle East & North Africa (excluding high income)Middle East & North Africa (IDA & IBRD countries)MoldovaMongoliaMontenegroMoroccoNamibiaNetherlandsNew CaledoniaNew ZealandNicaraguaNorth AmericaNorwayOECD membersOmanPakistanPanamaParaguayPeruPhilippinesPolandPortugalPost-demographic dividendQatarRomaniaRussian FederationRwandaSan MarinoSaudi ArabiaSenegalSerbiaSingaporeSlovak RepublicSloveniaSouth AfricaSouth AsiaSouth Asia (IDA & IBRD)SpainSri LankaSt. LuciaSt. Vincent and the GrenadinesSurinameSwedenSwitzerlandSyrian Arab RepublicTajikistanTanzaniaThailandTimor-LesteTongaTrinidad and TobagoTunisiaTurkeyUkraineUnited Arab EmiratesUnited KingdomUnited StatesUruguayVenezuela, RBWest Bank and GazaZimbabwe

Zeitlinie:

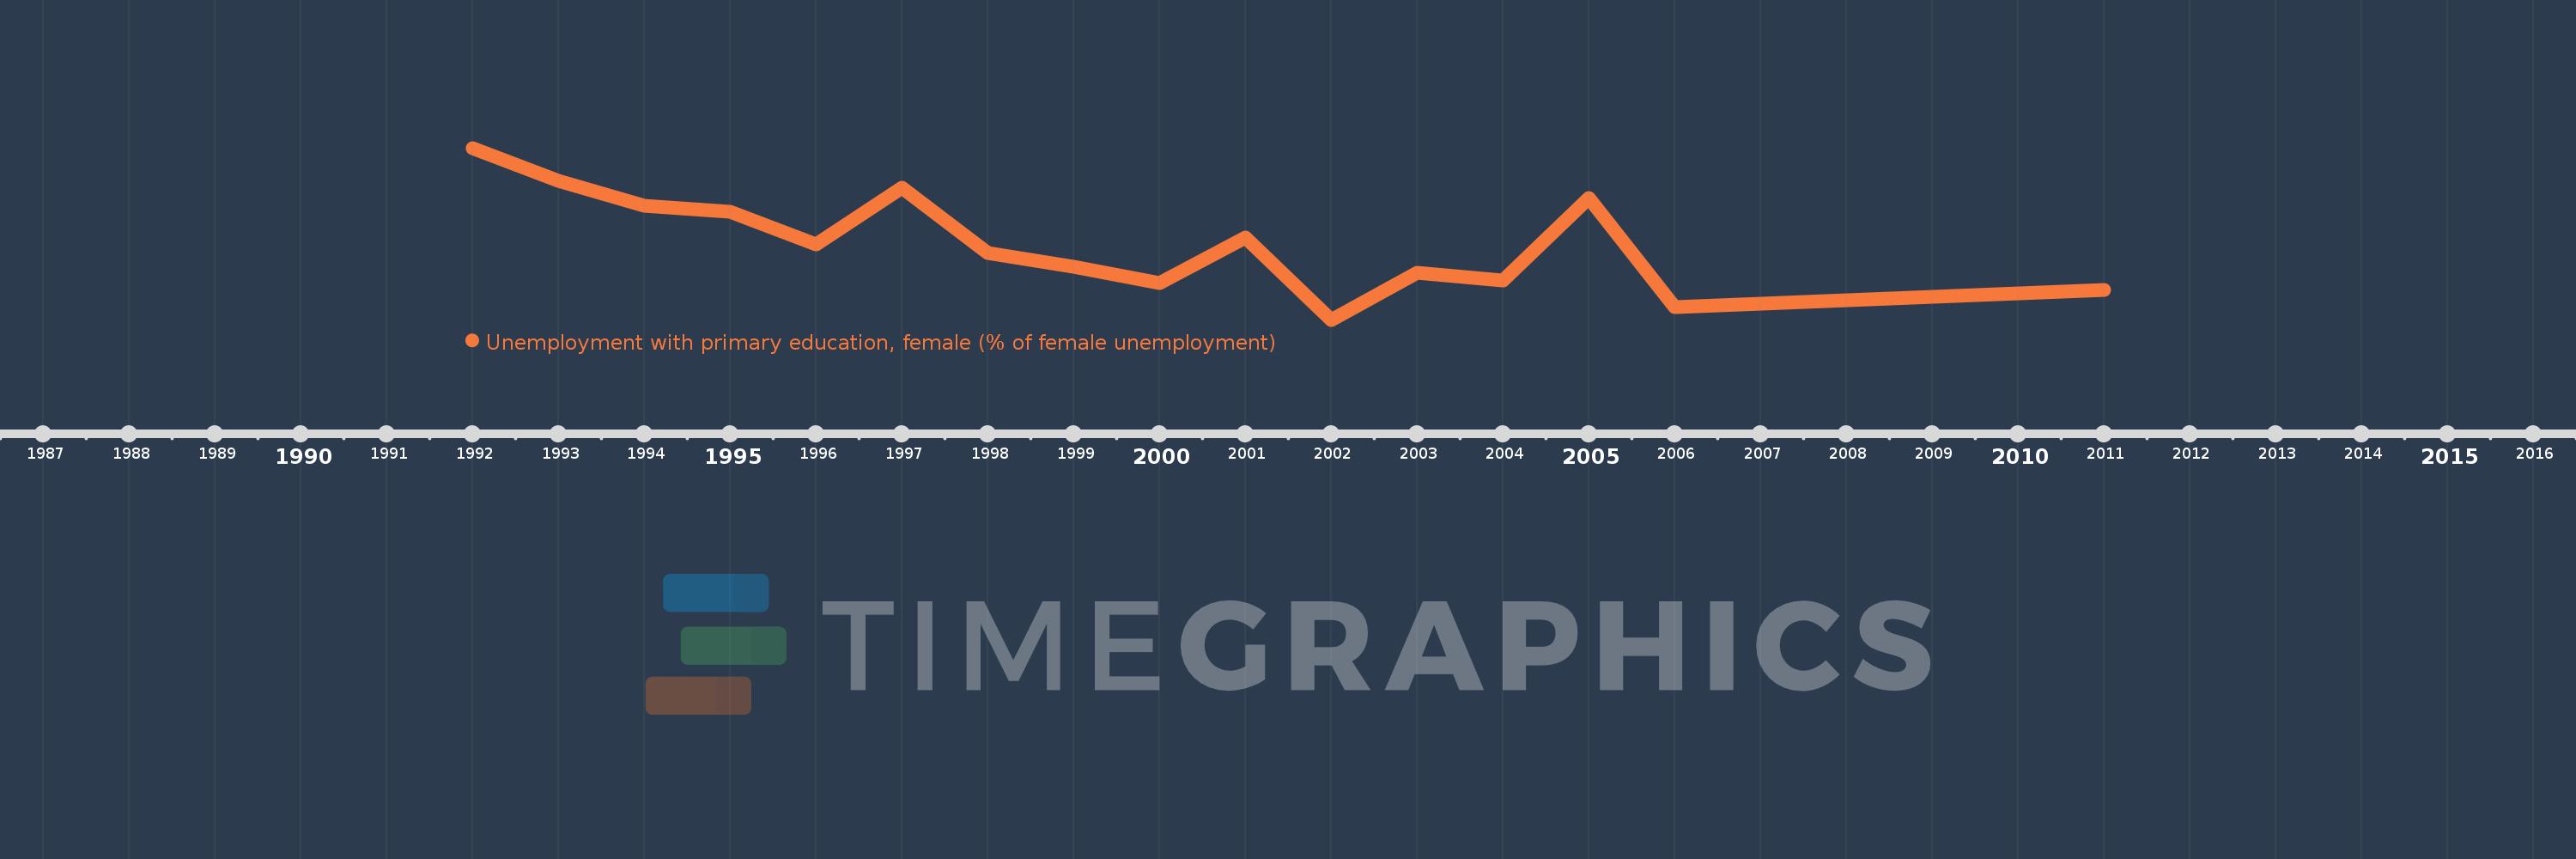
Diese Zeitleiste vorliegt die Graphik ab 1992 J. bis 2011 J. South Asia (IDA & IBRD). Die Angaben bis 1991 J. sind nicht vorhanden. Die Zahl aktueller Beobachtungen nach Daten: 16.

Die Quelle (Bezeichnung):

Kennzahlen der Weltentwicklung

Die Quelle (Einrichtung):

International Labour Organization, Key Indicators of the Labour Market database.

Kategorien:

Social Protection & Labor, Gender

Es wurde aktualisiert:

23 Apr 2017 Jahr

Kennzahlen der Wertänderungen vom Jahr zum Jahr

im Durchschnitt:
24.9
Minimum:
19.721
1 Jan 2002 Jahr
Maximum:
31.3
1 Jan 1992 Jahr
Zum Datum der Beobachtung
Wert
Absolute Veränderung
Die Veränderung bezüglich dem vorherigen Wert
1 Jan 1992 Jahr
31.3
+31.3
0.0%
1 Jan 1993 Jahr
29.1
-2.2
-7.03%
1 Jan 1994 Jahr
27.4
-1.7
-5.84%
1 Jan 1995 Jahr
27.0
-0.4
-1.46%
1 Jan 1996 Jahr
24.805
-2.195
-8.13%
1 Jan 1997 Jahr
28.646
+3.842
15.49%
1 Jan 1998 Jahr
24.2
-4.446
-15.52%
1 Jan 1999 Jahr
23.3
-0.9
-3.72%
1 Jan 2000 Jahr
22.2
-1.1
-4.72%
1 Jan 2001 Jahr
25.253
+3.053
13.75%
1 Jan 2002 Jahr
19.721
-5.532
-21.91%
1 Jan 2003 Jahr
22.878
+3.157
16.01%
1 Jan 2004 Jahr
22.359
-0.52
-2.27%
1 Jan 2005 Jahr
27.91
+5.551
24.83%
1 Jan 2006 Jahr
20.596
-7.314
-26.21%
1 Jan 2011 Jahr
21.733
+1.137
5.52%

Bewertung der Länder gemäß mit laufender Statistik nach Jahren