29
/de/
de
AIzaSyAYiBZKx7MnpbEhh9jyipgxe19OcubqV5w
April 1, 2024
57775
South Asia
SAS
false
2
1
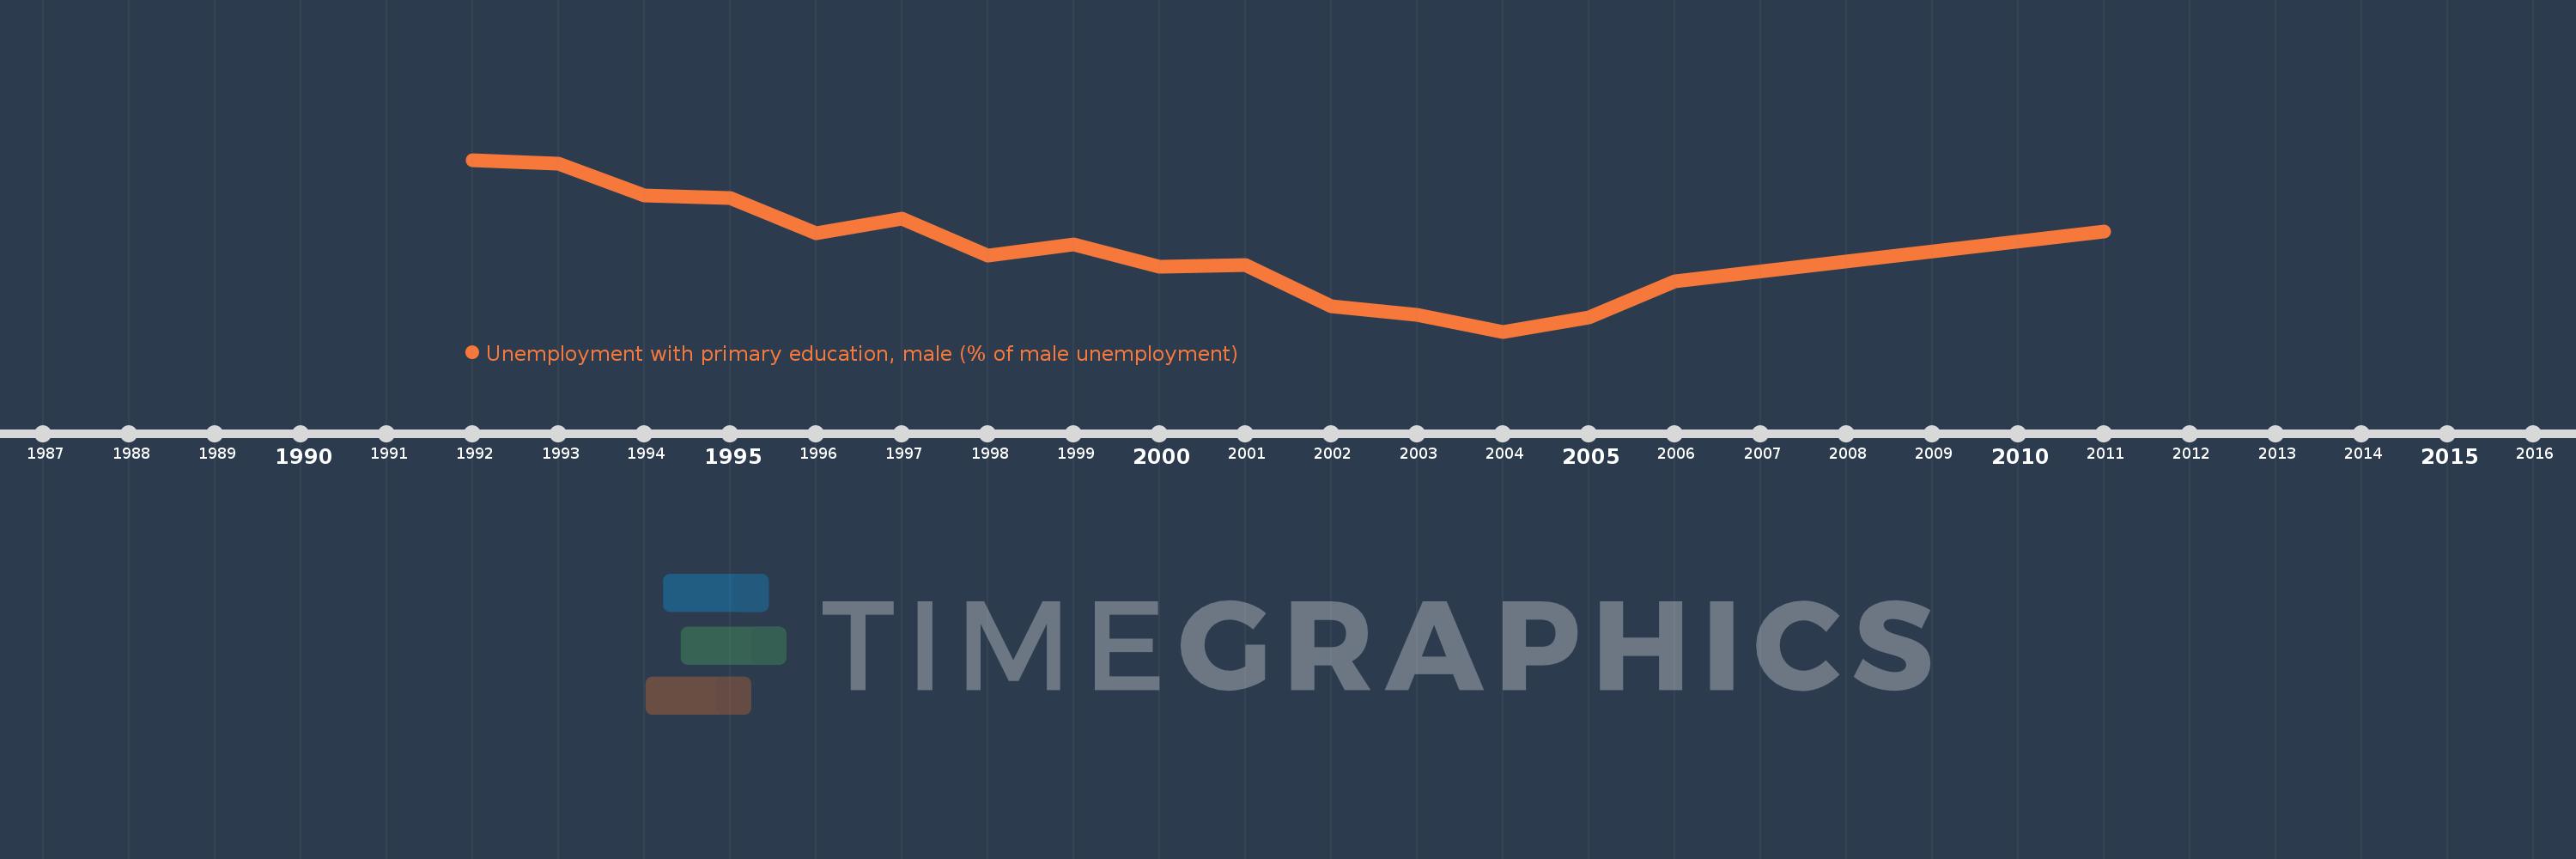
Unemployment with primary education, male (% of male unemployment)
2011,2006,2005,2004,2003,2002,2001,2000,1999,1998,1997,1996,1995,1994,1993,1992
Diese Statistik in anderen Ländern:
Zeitlinie:
Diese Zeitleiste vorliegt die Graphik ab 1992 J. bis 2011 J. South Asia. Die Angaben bis 1991 J. sind nicht vorhanden. Die Zahl aktueller Beobachtungen nach Daten: 16.
Die Quelle (Bezeichnung):
Kennzahlen der Weltentwicklung
Die Quelle (Einrichtung):
International Labour Organization, Key Indicators of the Labour Market database.
Kategorien:
Social Protection & Labor, Gender
Es wurde aktualisiert:
23 Apr 2017 Jahr
Kennzahlen der Wertänderungen vom Jahr zum Jahr
Minimum:
25.897
1 Jan 2004 Jahr
Maximum:
39.9
1 Jan 1992 Jahr
Zum Datum der Beobachtung
Wert
Absolute Veränderung
Die Veränderung bezüglich dem vorherigen Wert
1 Jan 1992 Jahr
39.9
+39.9
0.0%
1 Jan 1993 Jahr
39.6
-0.3
-0.75%
1 Jan 1994 Jahr
37.0
-2.6
-6.57%
1 Jan 1995 Jahr
36.8
-0.2
-0.54%
1 Jan 1996 Jahr
33.904
-2.896
-7.87%
1 Jan 1997 Jahr
35.112
+1.208
3.56%
1 Jan 1998 Jahr
32.1
-3.012
-8.58%
1 Jan 1999 Jahr
33.0
+0.9
2.8%
1 Jan 2000 Jahr
31.2
-1.8
-5.45%
1 Jan 2001 Jahr
31.341
+0.141
0.45%
1 Jan 2002 Jahr
27.939
-3.403
-10.86%
1 Jan 2003 Jahr
27.285
-0.654
-2.34%
1 Jan 2004 Jahr
25.897
-1.387
-5.08%
1 Jan 2005 Jahr
27.052
+1.154
4.46%
1 Jan 2006 Jahr
29.997
+2.946
10.89%
1 Jan 2011 Jahr
34.054
+4.057
13.52%
Bewertung der Länder gemäß mit laufender Statistik nach Jahren


Kommentare: