29
/de/
de
AIzaSyAYiBZKx7MnpbEhh9jyipgxe19OcubqV5w
April 1, 2024
56923
South Asia
SAS
false
2
1
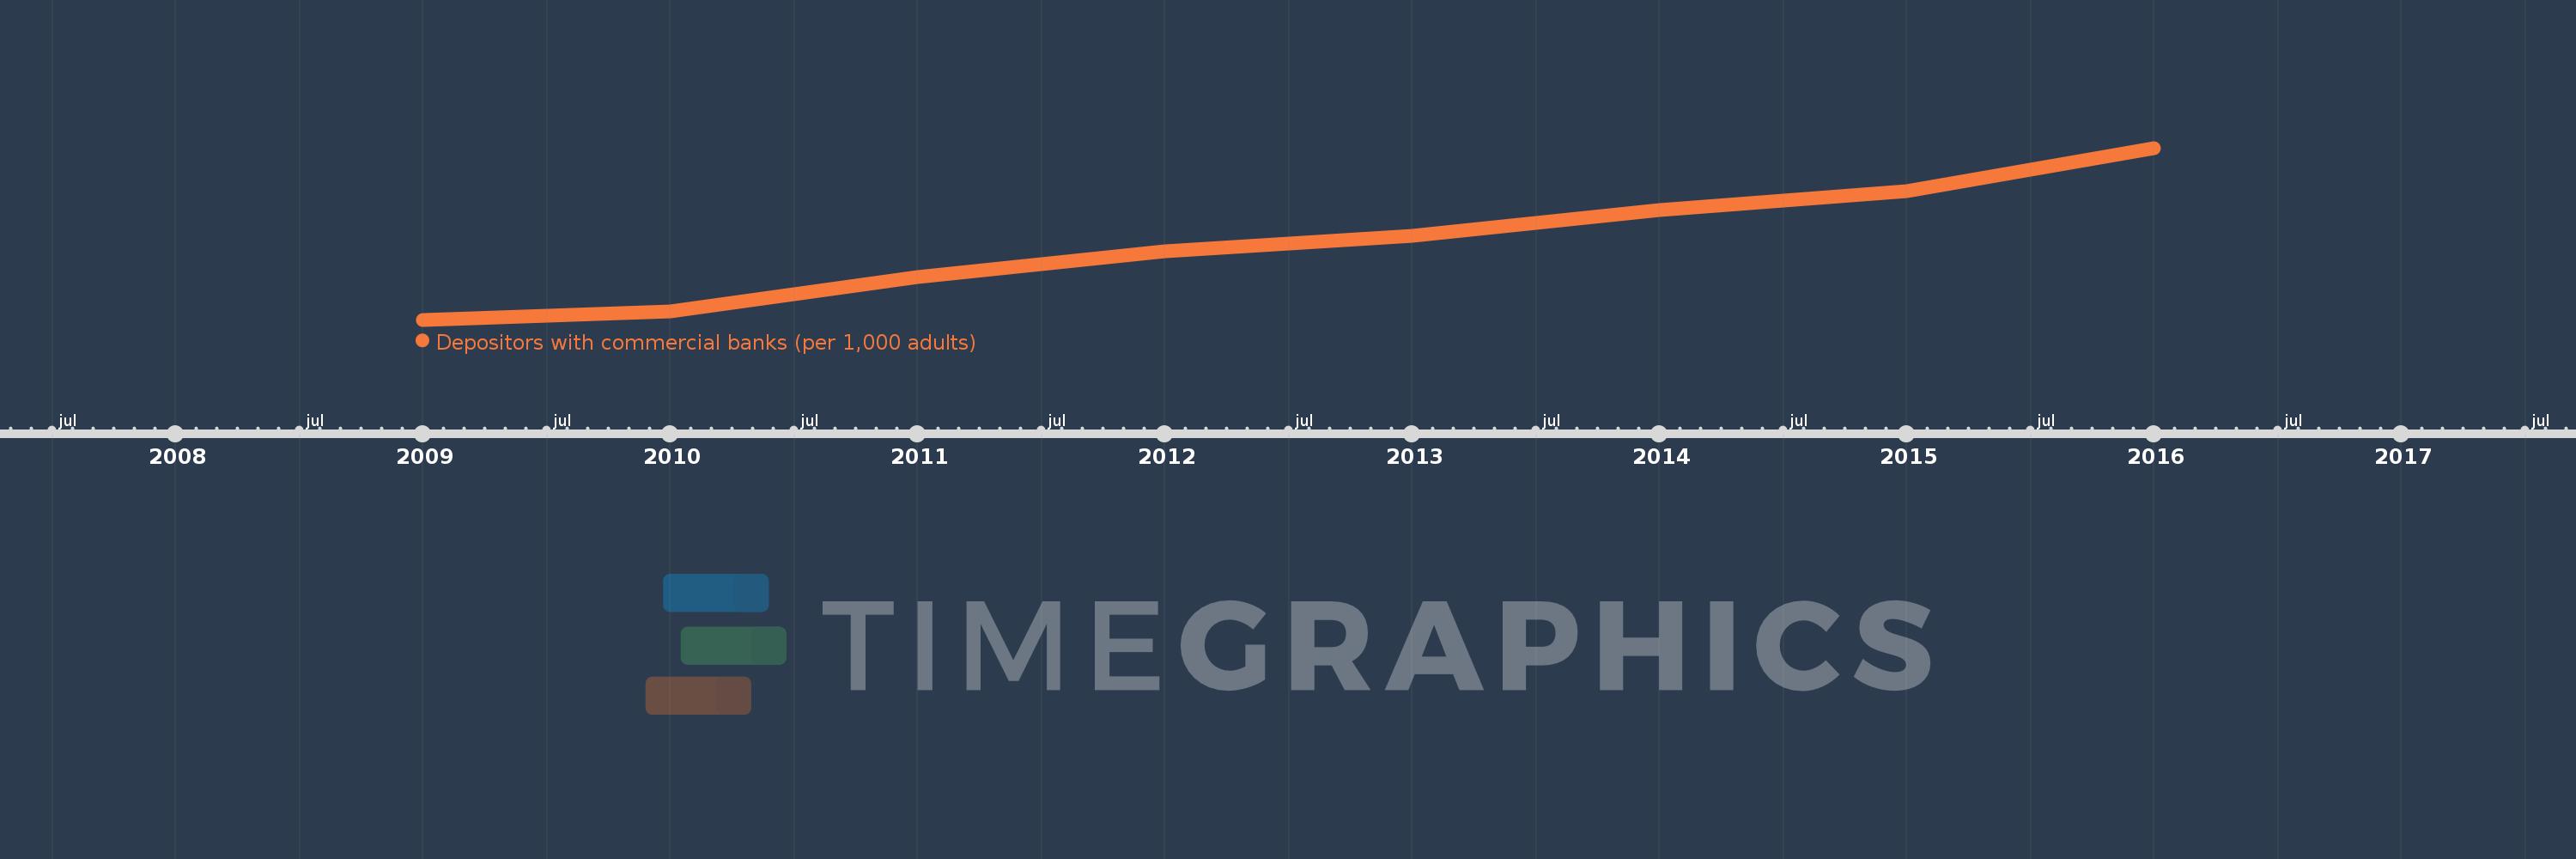
Depositors with commercial banks (per 1,000 adults)
2016,2015,2014,2013,2012,2011,2010,2009
Diese Statistik in anderen Ländern:
Zeitlinie:
Diese Zeitleiste vorliegt die Graphik ab 2009 J. bis 2016 J. South Asia. Die Angaben bis 2008 J. sind nicht vorhanden. Die Zahl aktueller Beobachtungen nach Daten: 8.
Die Quelle (Bezeichnung):
Kennzahlen der Weltentwicklung
Die Quelle (Einrichtung):
International Monetary Fund, Financial Access Survey.
Kategorien:
Financial Sector
Es wurde aktualisiert:
23 Apr 2017 Jahr
Kennzahlen der Wertänderungen vom Jahr zum Jahr
Minimum:
208.081
1 Jan 2009 Jahr
Maximum:
336.128
1 Jan 2016 Jahr
Zum Datum der Beobachtung
Wert
Absolute Veränderung
Die Veränderung bezüglich dem vorherigen Wert
1 Jan 2009 Jahr
208.081
+208.081
0.0%
1 Jan 2010 Jahr
214.039
+5.959
2.86%
1 Jan 2011 Jahr
240.116
+26.076
12.18%
1 Jan 2012 Jahr
258.926
+18.81
7.83%
1 Jan 2013 Jahr
270.932
+12.006
4.64%
1 Jan 2014 Jahr
289.871
+18.939
6.99%
1 Jan 2015 Jahr
304.138
+14.267
4.92%
1 Jan 2016 Jahr
336.128
+31.991
10.52%
Bewertung der Länder gemäß mit laufender Statistik nach Jahren


Kommentare: