29
/de/
de
AIzaSyAYiBZKx7MnpbEhh9jyipgxe19OcubqV5w
April 1, 2024
53630
Other small states
OSS
false
2
1
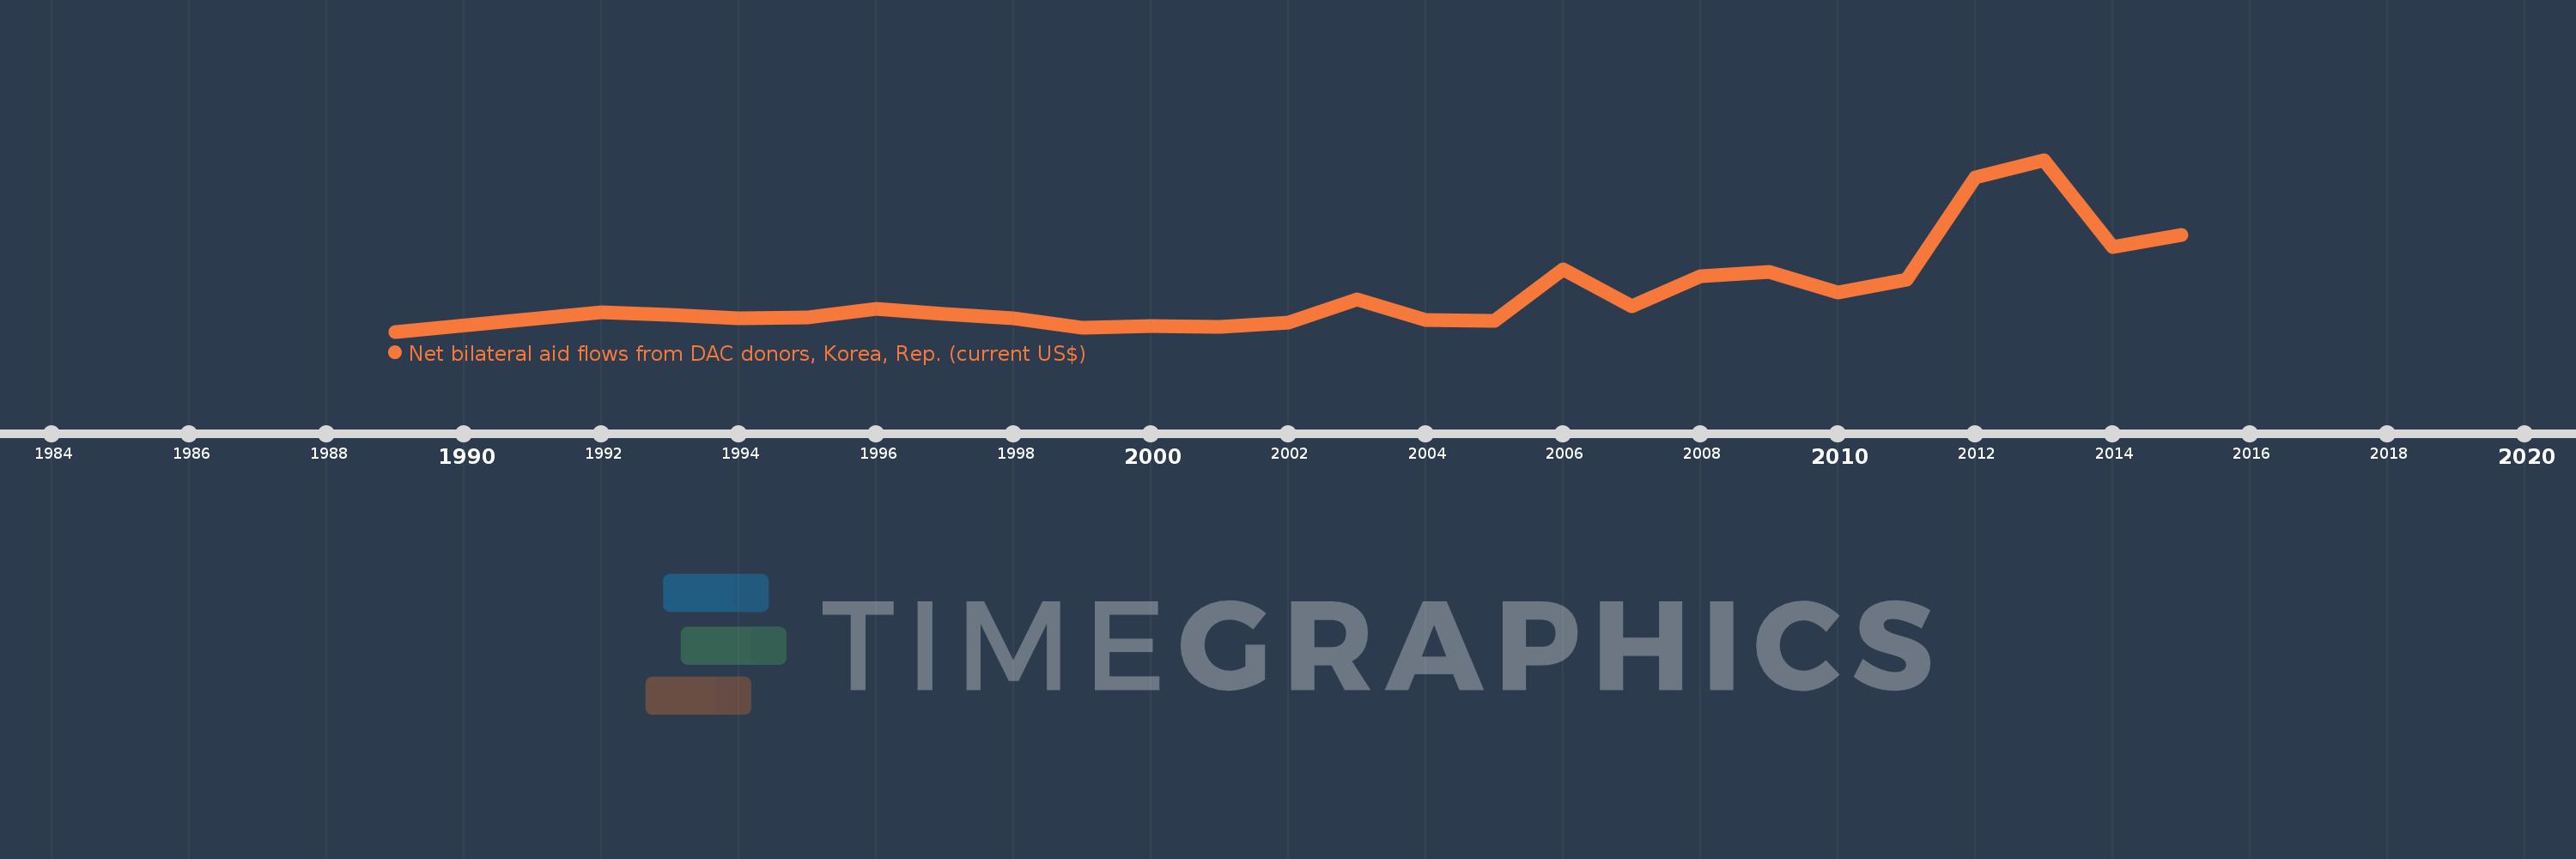
Net bilateral aid flows from DAC donors, Korea, Rep. (current US$)
2015,2014,2013,2012,2011,2010,2009,2008,2007,2006,2005,2004,2003,2002,2001,2000,1999,1998,1997,1996,1995,1994,1993,1992,1989
Diese Statistik in anderen Ländern:
AfghanistanAlbaniaAlgeriaAngolaAntigua and BarbudaArab WorldArgentinaArmeniaAzerbaijanBahamas, TheBahrainBangladeshBarbadosBelarusBelizeBeninBhutanBoliviaBosnia and HerzegovinaBotswanaBrazilBrunei DarussalamBulgariaBurkina FasoBurundiCabo VerdeCambodiaCameroonCaribbean small statesCentral African RepublicCentral Europe and the BalticsChadChileChinaColombiaComorosCongo, Dem. Rep.Congo, Rep.Costa RicaCote d'IvoireCroatiaCubaCzech RepublicDjiboutiDominicaDominican RepublicEast Asia & PacificEast Asia & Pacific (excluding high income)East Asia & Pacific (IDA & IBRD countries)EcuadorEgypt, Arab Rep.El SalvadorEquatorial GuineaEritreaEstoniaEthiopiaEuro areaEurope & Central AsiaEurope & Central Asia (excluding high income)Europe & Central Asia (IDA & IBRD countries)European UnionFijiFragile and conflict affected situationsGabonGambia, TheGeorgiaGhanaGrenadaGuatemalaGuineaGuinea-BissauGuyanaHaitiHeavily indebted poor countries (HIPC)High incomeHondurasHong Kong SAR, ChinaHungaryIBRD onlyIDA & IBRD totalIDA blendIDA onlyIDA totalIndiaIndonesiaIran, Islamic Rep.IraqIsraelJamaicaJordanKazakhstanKenyaKiribatiKorea, Dem. People’s Rep.KuwaitKyrgyz RepublicLao PDRLatin America & Caribbean Latin America & Caribbean (excluding high income)Latin America & the Caribbean (IDA & IBRD countries)LatviaLeast developed countries: UN classificationLebanonLesothoLiberiaLibyaLithuaniaLow & middle incomeLow incomeLower middle incomeMacedonia, FYRMadagascarMalawiMalaysiaMaldivesMaliMaltaMarshall IslandsMauritaniaMauritiusMexicoMicronesia, Fed. Sts.Middle East & North AfricaMiddle East & North Africa (excluding high income)Middle East & North Africa (IDA & IBRD countries)Middle incomeMoldovaMongoliaMontenegroMoroccoMozambiqueMyanmarNamibiaNauruNepalNicaraguaNigerNigeriaOECD membersOmanOther small statesPacific island small statesPakistanPalauPanamaPapua New GuineaParaguayPeruPhilippinesPolandQatarRomaniaRussian FederationRwandaSamoaSao Tome and PrincipeSaudi ArabiaSenegalSerbiaSeychellesSierra LeoneSingaporeSlovak RepublicSloveniaSmall statesSolomon IslandsSomaliaSouth AfricaSouth AsiaSouth Asia (IDA & IBRD)South SudanSri LankaSt. Kitts and NevisSt. LuciaSt. Vincent and the GrenadinesSub-Saharan Africa Sub-Saharan Africa (excluding high income)Sub-Saharan Africa (IDA & IBRD countries)SudanSurinameSwazilandSyrian Arab RepublicTajikistanTanzaniaThailandTimor-LesteTogoTongaTrinidad and TobagoTunisiaTurkeyTurkmenistanTuvaluUgandaUkraineUnited Arab EmiratesUpper middle incomeUruguayUzbekistanVanuatuVenezuela, RBVietnamWest Bank and GazaWorldYemen, Rep.ZambiaZimbabwe Zeitlinie:
Diese Zeitleiste vorliegt die Graphik ab 1989 J. bis 2015 J. Other small states. Die Angaben bis 1988 J. sind nicht vorhanden. Die Zahl aktueller Beobachtungen nach Daten: 25.
Die Quelle (Bezeichnung):
Kennzahlen der Weltentwicklung
Die Quelle (Einrichtung):
Development Assistance Committee of the Organisation for Economic Co-operation and Development, Geographical Distribution of Financial Flows to Developing Countries, Development Co-operation Report, and International Development Statistics database. Data are available online at: www.oecd.org/dac/stats/idsonline.
Kategorien:
Aid Effectiveness
Es wurde aktualisiert:
23 Apr 2017 Jahr
Kennzahlen der Wertänderungen vom Jahr zum Jahr
im Durchschnitt:
2.686 Mln.
Minimum:
30.0 Tsnd.
1 Jan 1989 Jahr
Maximum:
11.49 Mln.
1 Jan 2013 Jahr
Zum Datum der Beobachtung
Wert
Absolute Veränderung
Die Veränderung bezüglich dem vorherigen Wert
1 Jan 1989 Jahr
30.0 Tsnd.
+30.0 Tsnd.
0.0%
1 Jan 1992 Jahr
1.33 Mln.
+1.3 Mln.
4.33 Tsnd.%
1 Jan 1993 Jahr
1.13 Mln.
-200.0 Tsnd.
-15.04%
1 Jan 1994 Jahr
920.0 Tsnd.
-210.0 Tsnd.
-18.58%
1 Jan 1995 Jahr
1000.0 Tsnd.
+80.0 Tsnd.
8.7%
1 Jan 1996 Jahr
1.55 Mln.
+550.0 Tsnd.
55.0%
1 Jan 1997 Jahr
1.19 Mln.
-360.0 Tsnd.
-23.23%
1 Jan 1998 Jahr
940.0 Tsnd.
-250.0 Tsnd.
-21.01%
1 Jan 1999 Jahr
260.0 Tsnd.
-680.0 Tsnd.
-72.34%
1 Jan 2000 Jahr
380.0 Tsnd.
+120.0 Tsnd.
46.15%
1 Jan 2001 Jahr
320.0 Tsnd.
-60.0 Tsnd.
-15.79%
1 Jan 2002 Jahr
620.0 Tsnd.
+300.0 Tsnd.
93.75%
1 Jan 2003 Jahr
2.16 Mln.
+1.54 Mln.
248.39%
1 Jan 2004 Jahr
830.0 Tsnd.
-1.33 Mln.
-61.57%
1 Jan 2005 Jahr
750.0 Tsnd.
-80.0 Tsnd.
-9.64%
1 Jan 2006 Jahr
4.17 Mln.
+3.42 Mln.
456.0%
1 Jan 2007 Jahr
1.7 Mln.
-2.47 Mln.
-59.23%
1 Jan 2008 Jahr
3.74 Mln.
+2.04 Mln.
120.0%
1 Jan 2009 Jahr
4.04 Mln.
+300.0 Tsnd.
8.02%
1 Jan 2010 Jahr
2.66 Mln.
-1.38 Mln.
-34.16%
1 Jan 2011 Jahr
3.51 Mln.
+850.0 Tsnd.
31.95%
1 Jan 2012 Jahr
10.3 Mln.
+6.79 Mln.
193.45%
1 Jan 2013 Jahr
11.49 Mln.
+1.19 Mln.
11.55%
1 Jan 2014 Jahr
5.68 Mln.
-5.81 Mln.
-50.57%
1 Jan 2015 Jahr
6.46 Mln.
+780.0 Tsnd.
13.73%
Bewertung der Länder gemäß mit laufender Statistik nach Jahren


Kommentare: