29
/de/
de
AIzaSyAYiBZKx7MnpbEhh9jyipgxe19OcubqV5w
April 1, 2024
51816
North America
NAC
false
2
1
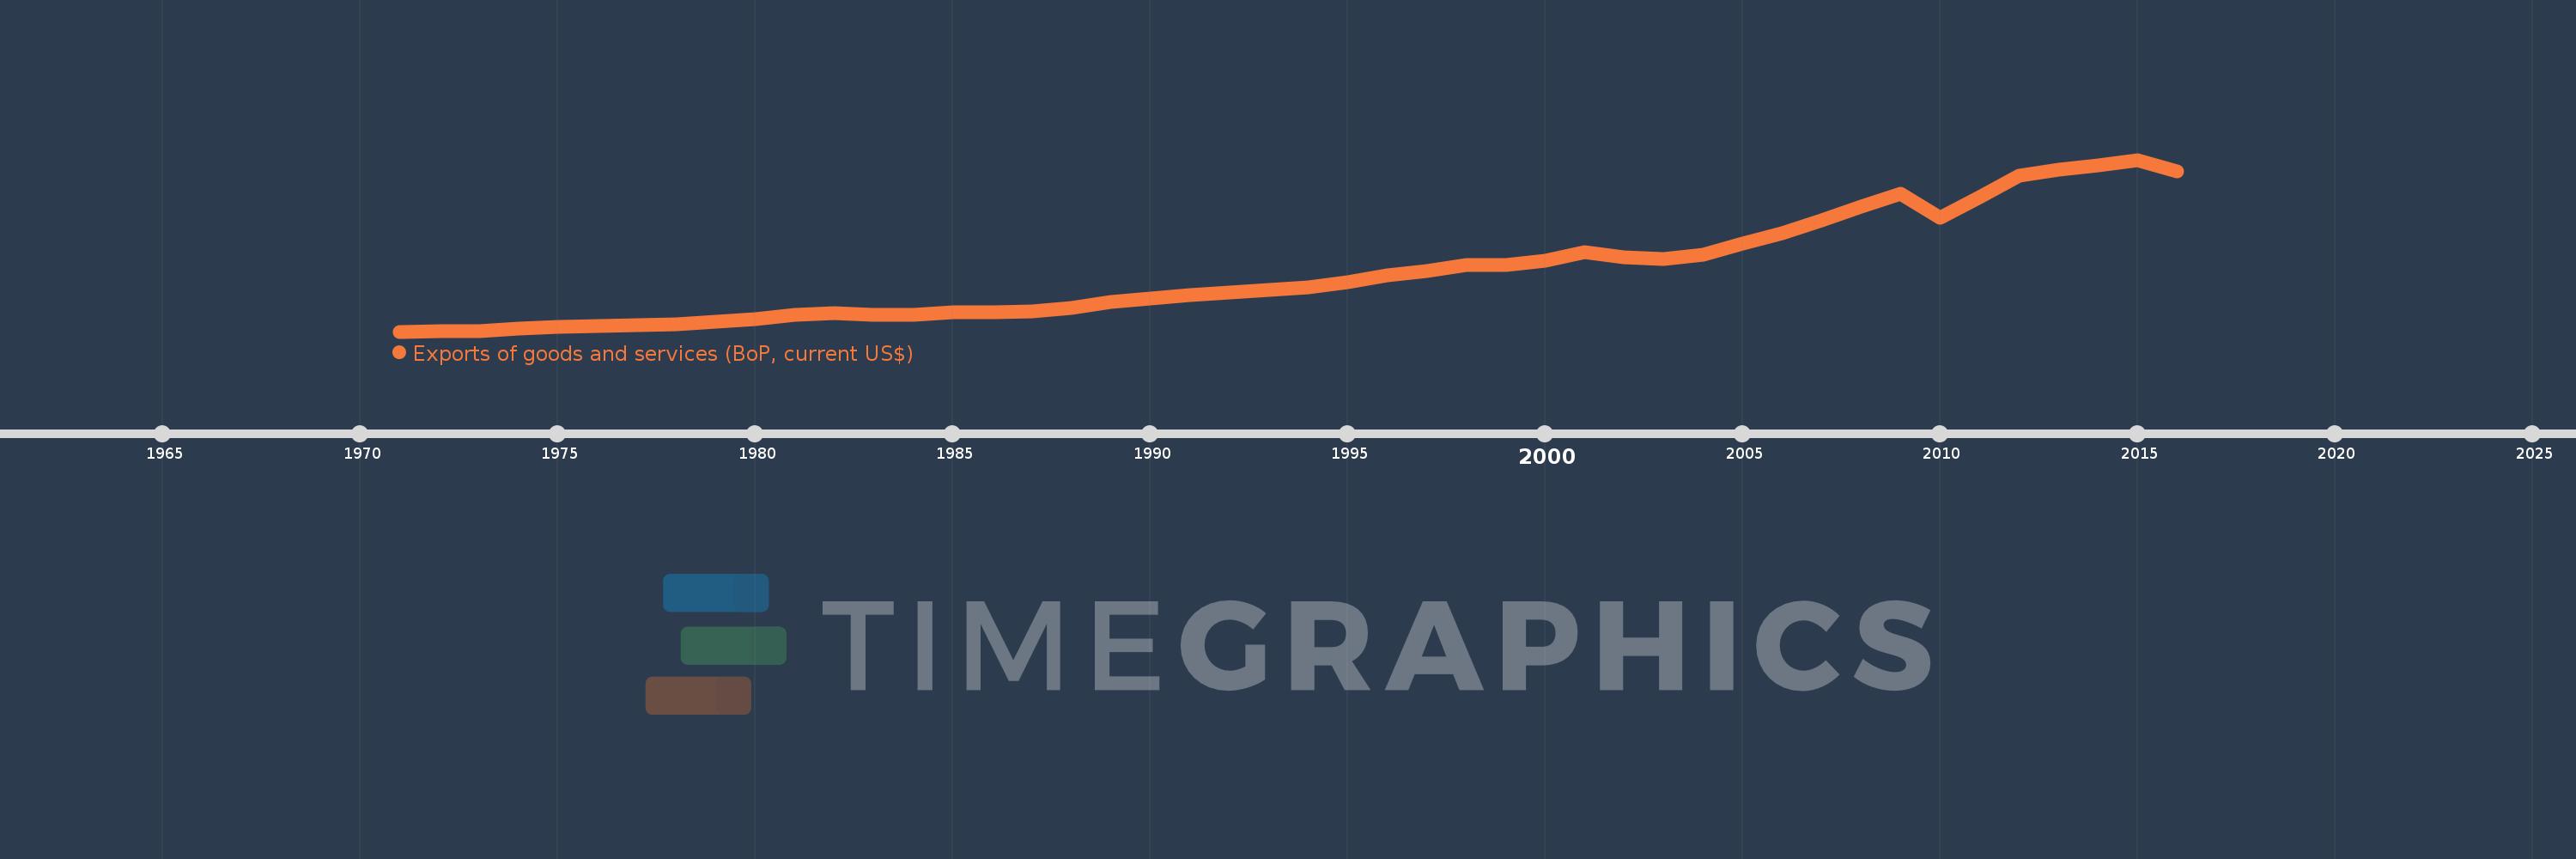
Exports of goods and services (BoP, current US$)
2016,2015,2014,2013,2012,2011,2010,2009,2008,2007,2006,2005,2004,2003,2002,2001,2000,1999,1998,1997,1996,1995,1994,1993,1992,1991,1990,1989,1988,1987,1986,1985,1984,1983,1982,1981,1980,1979,1978,1977,1976,1975,1974,1973,1972,1971
Diese Statistik in anderen Ländern:
AfghanistanAlbaniaAlgeriaAngolaAntigua and BarbudaArab WorldArgentinaArmeniaArubaAustraliaAustriaAzerbaijanBahamas, TheBahrainBangladeshBarbadosBelarusBelgiumBelizeBeninBermudaBhutanBoliviaBosnia and HerzegovinaBotswanaBrazilBrunei DarussalamBulgariaBurkina FasoBurundiCabo VerdeCambodiaCameroonCanadaCaribbean small statesCentral African RepublicCentral Europe and the BalticsChadChileChinaColombiaComorosCongo, Dem. Rep.Congo, Rep.Costa RicaCote d'IvoireCroatiaCuracaoCyprusCzech RepublicDenmarkDjiboutiDominicaDominican RepublicEarly-demographic dividendEast Asia & PacificEast Asia & Pacific (excluding high income)East Asia & Pacific (IDA & IBRD countries)EcuadorEgypt, Arab Rep.El SalvadorEquatorial GuineaEritreaEstoniaEthiopiaEuro areaEurope & Central AsiaEurope & Central Asia (excluding high income)Europe & Central Asia (IDA & IBRD countries)European UnionFaroe IslandsFijiFinlandFragile and conflict affected situationsFranceFrench PolynesiaGabonGambia, TheGeorgiaGermanyGhanaGreeceGrenadaGuatemalaGuineaGuinea-BissauGuyanaHaitiHeavily indebted poor countries (HIPC)High incomeHondurasHong Kong SAR, ChinaHungaryIBRD onlyIcelandIDA & IBRD totalIDA blendIDA onlyIDA totalIndiaIndonesiaIran, Islamic Rep.IraqIrelandIsraelItalyJamaicaJapanJordanKazakhstanKenyaKiribatiKorea, Rep.KosovoKuwaitKyrgyz RepublicLao PDRLate-demographic dividendLatin America & Caribbean Latin America & Caribbean (excluding high income)Latin America & the Caribbean (IDA & IBRD countries)LatviaLeast developed countries: UN classificationLebanonLesothoLiberiaLibyaLithuaniaLow & middle incomeLow incomeLower middle incomeLuxembourgMacao SAR, ChinaMacedonia, FYRMadagascarMalawiMalaysiaMaldivesMaliMaltaMarshall IslandsMauritaniaMauritiusMexicoMicronesia, Fed. Sts.Middle East & North Africa (excluding high income)Middle East & North Africa (IDA & IBRD countries)Middle incomeMoldovaMongoliaMontenegroMoroccoMozambiqueMyanmarNamibiaNepalNetherlandsNew CaledoniaNicaraguaNigerNigeriaNorth AmericaNorwayOECD membersOmanPacific island small statesPakistanPalauPanamaPapua New GuineaParaguayPeruPhilippinesPolandPortugalPost-demographic dividendPre-demographic dividendQatarRomaniaRussian FederationRwandaSamoaSao Tome and PrincipeSaudi ArabiaSenegalSerbiaSeychellesSierra LeoneSingaporeSint Maarten (Dutch part)Slovak RepublicSloveniaSolomon IslandsSouth AfricaSouth AsiaSouth Asia (IDA & IBRD)South SudanSpainSri LankaSt. Kitts and NevisSt. LuciaSt. Vincent and the GrenadinesSub-Saharan Africa Sub-Saharan Africa (excluding high income)Sub-Saharan Africa (IDA & IBRD countries)SudanSurinameSwazilandSwedenSwitzerlandSyrian Arab RepublicTajikistanTanzaniaThailandTimor-LesteTogoTongaTrinidad and TobagoTunisiaTurkeyTuvaluUgandaUkraineUnited KingdomUnited StatesUpper middle incomeUruguayVanuatuVenezuela, RBVietnamWest Bank and GazaWorldYemen, Rep.ZambiaZimbabwe Zeitlinie:
Diese Zeitleiste vorliegt die Graphik ab 1971 J. bis 2016 J. North America. Die Angaben bis 1970 J. sind nicht vorhanden. Die Zahl aktueller Beobachtungen nach Daten: 46.
Die Quelle (Bezeichnung):
Kennzahlen der Weltentwicklung
Die Quelle (Einrichtung):
International Monetary Fund, Balance of Payments Statistics Yearbook and data files.
Kategorien:
Economy & Growth, Trade
Es wurde aktualisiert:
23 Apr 2017 Jahr
Kennzahlen der Wertänderungen vom Jahr zum Jahr
im Durchschnitt:
1.062 Trln
Minimum:
73.169 Mlrd.
1 Jan 1971 Jahr
Maximum:
2.943 Trln
1 Jan 2015 Jahr
Zum Datum der Beobachtung
Wert
Absolute Veränderung
Die Veränderung bezüglich dem vorherigen Wert
1 Jan 1971 Jahr
73.169 Mlrd.
+73.169 Mlrd.
0.0%
1 Jan 1972 Jahr
76.992 Mlrd.
+3.823 Mlrd.
5.22%
1 Jan 1973 Jahr
86.769 Mlrd.
+9.777 Mlrd.
12.7%
1 Jan 1974 Jahr
118.282 Mlrd.
+31.514 Mlrd.
36.32%
1 Jan 1975 Jahr
157.653 Mlrd.
+39.37 Mlrd.
33.29%
1 Jan 1976 Jahr
168.655 Mlrd.
+11.002 Mlrd.
6.98%
1 Jan 1977 Jahr
187.191 Mlrd.
+18.536 Mlrd.
10.99%
1 Jan 1978 Jahr
199.953 Mlrd.
+12.762 Mlrd.
6.82%
1 Jan 1979 Jahr
231.13 Mlrd.
+31.177 Mlrd.
15.59%
1 Jan 1980 Jahr
287.307 Mlrd.
+56.177 Mlrd.
24.31%
1 Jan 1981 Jahr
347.057 Mlrd.
+59.75 Mlrd.
20.8%
1 Jan 1982 Jahr
375.584 Mlrd.
+28.528 Mlrd.
8.22%
1 Jan 1983 Jahr
354.57 Mlrd.
-21.015 Mlrd.
-5.6%
1 Jan 1984 Jahr
351.336 Mlrd.
-3.234 Mlrd.
-0.91%
1 Jan 1985 Jahr
390.786 Mlrd.
+39.45 Mlrd.
11.23%
1 Jan 1986 Jahr
389.968 Mlrd.
-818.058 Mln.
-0.21%
1 Jan 1987 Jahr
412.43 Mlrd.
+22.462 Mlrd.
5.76%
1 Jan 1988 Jahr
461.598 Mlrd.
+49.168 Mlrd.
11.92%
1 Jan 1989 Jahr
564.01 Mlrd.
+102.412 Mlrd.
22.19%
1 Jan 1990 Jahr
629.174 Mlrd.
+65.163 Mlrd.
11.55%
1 Jan 1991 Jahr
684.785 Mlrd.
+55.612 Mlrd.
8.84%
1 Jan 1992 Jahr
727.522 Mlrd.
+42.737 Mlrd.
6.24%
1 Jan 1993 Jahr
772.521 Mlrd.
+44.999 Mlrd.
6.19%
1 Jan 1994 Jahr
811.638 Mlrd.
+39.116 Mlrd.
5.06%
1 Jan 1995 Jahr
893.396 Mlrd.
+81.758 Mlrd.
10.07%
1 Jan 1996 Jahr
1.013 Trln
+120.02 Mlrd.
13.43%
1 Jan 1997 Jahr
1.086 Trln
+72.399 Mlrd.
7.14%
1 Jan 1998 Jahr
1.184 Trln
+98.593 Mlrd.
9.08%
1 Jan 1999 Jahr
1.187 Trln
+2.767 Mlrd.
0.23%
1 Jan 2000 Jahr
1.254 Trln
+66.993 Mlrd.
5.64%
1 Jan 2001 Jahr
1.405 Trln
+150.625 Mlrd.
12.01%
1 Jan 2002 Jahr
1.317 Trln
-88.267 Mlrd.
-6.28%
1 Jan 2003 Jahr
1.283 Trln
-33.201 Mlrd.
-2.52%
1 Jan 2004 Jahr
1.351 Trln
+67.362 Mlrd.
5.25%
1 Jan 2005 Jahr
1.545 Trln
+193.984 Mlrd.
14.36%
1 Jan 2006 Jahr
1.718 Trln
+173.53 Mlrd.
11.23%
1 Jan 2007 Jahr
1.924 Trln
+205.941 Mlrd.
11.99%
1 Jan 2008 Jahr
2.157 Trln
+232.647 Mlrd.
12.09%
1 Jan 2009 Jahr
2.379 Trln
+222.063 Mlrd.
10.3%
1 Jan 2010 Jahr
1.976 Trln
-402.74 Mlrd.
-16.93%
1 Jan 2011 Jahr
2.324 Trln
+348.172 Mlrd.
17.62%
1 Jan 2012 Jahr
2.675 Trln
+350.83 Mlrd.
15.09%
1 Jan 2013 Jahr
2.772 Trln
+96.454 Mlrd.
3.61%
1 Jan 2014 Jahr
2.851 Trln
+79.755 Mlrd.
2.88%
1 Jan 2015 Jahr
2.943 Trln
+91.512 Mlrd.
3.21%
1 Jan 2016 Jahr
2.752 Trln
-191.006 Mlrd.
-6.49%
Bewertung der Länder gemäß mit laufender Statistik nach Jahren


Kommentare: