29
/de/
de
AIzaSyAYiBZKx7MnpbEhh9jyipgxe19OcubqV5w
April 1, 2024
50002
Middle East & North Africa (IDA & IBRD countries)
TMN
false
2
1
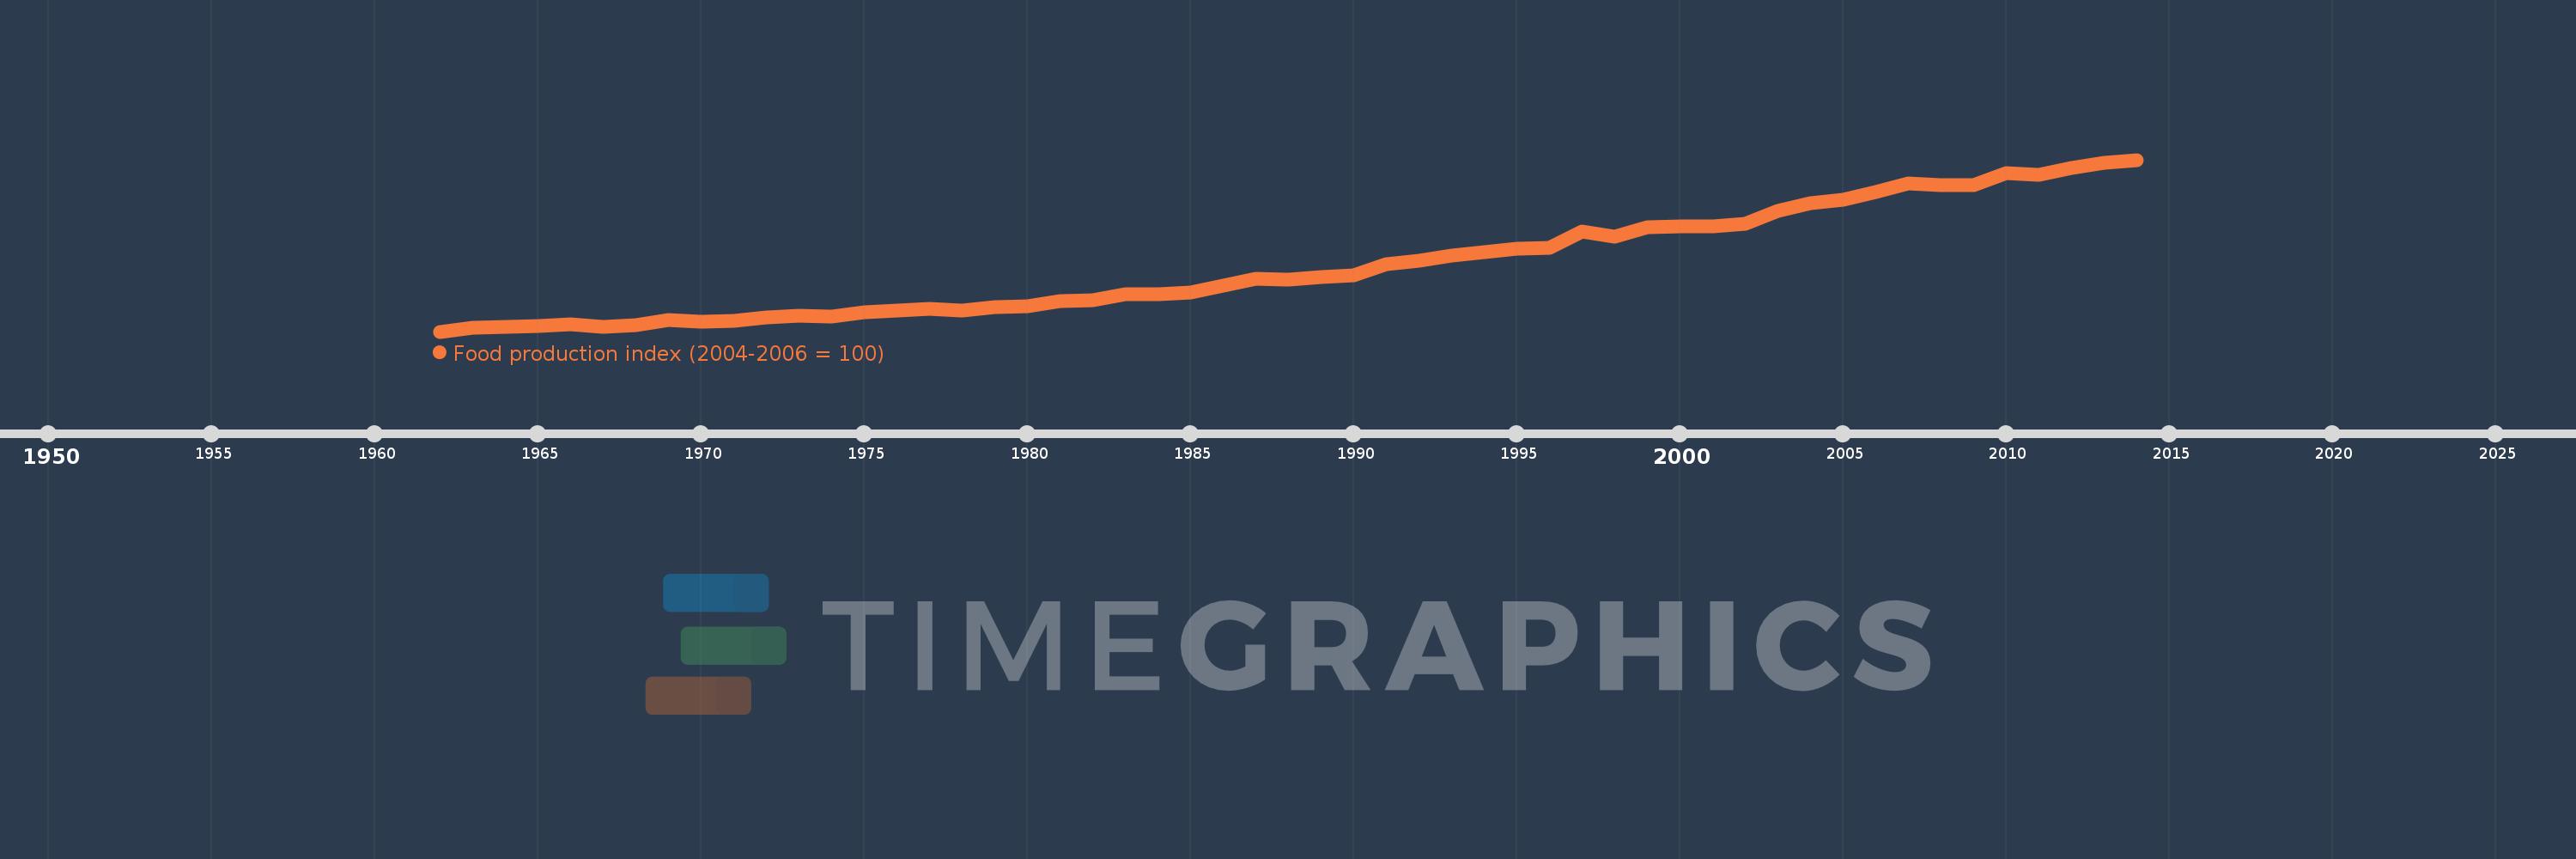
Food production index (2004-2006 = 100)
2014,2013,2012,2011,2010,2009,2008,2007,2006,2005,2004,2003,2002,2001,2000,1999,1998,1997,1996,1995,1994,1993,1992,1991,1990,1989,1988,1987,1986,1985,1984,1983,1982,1981,1980,1979,1978,1977,1976,1975,1974,1973,1972,1971,1970,1969,1968,1967,1966,1965,1964,1963,1962
Diese Statistik in anderen Ländern:
AfghanistanAlbaniaAlgeriaAmerican SamoaAngolaAntigua and BarbudaArab WorldArgentinaArmeniaAustraliaAustriaAzerbaijanBahamas, TheBahrainBangladeshBarbadosBelarusBelgiumBelizeBeninBermudaBhutanBoliviaBosnia and HerzegovinaBotswanaBrazilBritish Virgin IslandsBrunei DarussalamBulgariaBurkina FasoBurundiCabo VerdeCambodiaCameroonCanadaCaribbean small statesCayman IslandsCentral African RepublicCentral Europe and the BalticsChadChileChinaColombiaComorosCongo, Dem. Rep.Congo, Rep.Costa RicaCote d'IvoireCroatiaCubaCyprusCzech RepublicDenmarkDjiboutiDominicaDominican RepublicEarly-demographic dividendEast Asia & PacificEast Asia & Pacific (excluding high income)East Asia & Pacific (IDA & IBRD countries)EcuadorEgypt, Arab Rep.El SalvadorEquatorial GuineaEritreaEstoniaEthiopiaEuro areaEurope & Central AsiaEurope & Central Asia (excluding high income)Europe & Central Asia (IDA & IBRD countries)European UnionFaroe IslandsFijiFinlandFragile and conflict affected situationsFranceFrench PolynesiaGabonGambia, TheGeorgiaGermanyGhanaGreeceGreenlandGrenadaGuamGuatemalaGuineaGuinea-BissauGuyanaHaitiHeavily indebted poor countries (HIPC)High incomeHondurasHong Kong SAR, ChinaHungaryIBRD onlyIcelandIDA & IBRD totalIDA blendIDA onlyIDA totalIndiaIndonesiaIran, Islamic Rep.IraqIrelandIsraelItalyJamaicaJapanJordanKazakhstanKenyaKiribatiKorea, Dem. People’s Rep.Korea, Rep.KuwaitKyrgyz RepublicLao PDRLate-demographic dividendLatin America & Caribbean Latin America & Caribbean (excluding high income)Latin America & the Caribbean (IDA & IBRD countries)LatviaLeast developed countries: UN classificationLebanonLesothoLiberiaLibyaLiechtensteinLithuaniaLow & middle incomeLow incomeLower middle incomeLuxembourgMacao SAR, ChinaMacedonia, FYRMadagascarMalawiMalaysiaMaldivesMaliMaltaMarshall IslandsMauritaniaMauritiusMexicoMicronesia, Fed. Sts.Middle East & North AfricaMiddle East & North Africa (excluding high income)Middle East & North Africa (IDA & IBRD countries)Middle incomeMoldovaMongoliaMontenegroMoroccoMozambiqueMyanmarNamibiaNauruNepalNetherlandsNew CaledoniaNew ZealandNicaraguaNigerNigeriaNorth AmericaNorwayOECD membersOmanOther small statesPacific island small statesPakistanPanamaPapua New GuineaParaguayPeruPhilippinesPolandPortugalPost-demographic dividendPre-demographic dividendPuerto RicoQatarRomaniaRussian FederationRwandaSamoaSao Tome and PrincipeSaudi ArabiaSenegalSerbiaSeychellesSierra LeoneSingaporeSlovak RepublicSloveniaSmall statesSolomon IslandsSomaliaSouth AfricaSouth AsiaSouth Asia (IDA & IBRD)SpainSri LankaSt. Kitts and NevisSt. LuciaSt. Vincent and the GrenadinesSub-Saharan Africa Sub-Saharan Africa (excluding high income)Sub-Saharan Africa (IDA & IBRD countries)SudanSurinameSwazilandSwedenSwitzerlandSyrian Arab RepublicTajikistanTanzaniaThailandTimor-LesteTogoTongaTrinidad and TobagoTunisiaTurkeyTurkmenistanTuvaluUgandaUkraineUnited Arab EmiratesUnited KingdomUnited StatesUpper middle incomeUruguayUzbekistanVanuatuVenezuela, RBVietnamVirgin Islands (U.S.)West Bank and GazaWorldYemen, Rep.ZambiaZimbabwe Zeitlinie:
Diese Zeitleiste vorliegt die Graphik ab 1962 J. bis 2014 J. Middle East & North Africa (IDA & IBRD countries). Die Angaben bis 1961 J. sind nicht vorhanden. Die Zahl aktueller Beobachtungen nach Daten: 53.
Die Quelle (Bezeichnung):
Kennzahlen der Weltentwicklung
Die Quelle (Einrichtung):
Food and Agriculture Organization, electronic files and web site.
Kategorien:
Agriculture & Rural Development
Es wurde aktualisiert:
23 Apr 2017 Jahr
Kennzahlen der Wertänderungen vom Jahr zum Jahr
Minimum:
20.209
1 Jan 1962 Jahr
Maximum:
118.444
1 Jan 2014 Jahr
Zum Datum der Beobachtung
Wert
Absolute Veränderung
Die Veränderung bezüglich dem vorherigen Wert
1 Jan 1962 Jahr
20.209
+20.209
0.0%
1 Jan 1963 Jahr
22.496
+2.287
11.32%
1 Jan 1964 Jahr
22.863
+0.367
1.63%
1 Jan 1965 Jahr
23.196
+0.332
1.45%
1 Jan 1966 Jahr
24.517
+1.321
5.7%
1 Jan 1967 Jahr
23.075
-1.442
-5.88%
1 Jan 1968 Jahr
24.081
+1.006
4.36%
1 Jan 1969 Jahr
26.771
+2.689
11.17%
1 Jan 1970 Jahr
26.099
-0.671
-2.51%
1 Jan 1971 Jahr
26.32
+0.221
0.84%
1 Jan 1972 Jahr
28.471
+2.151
8.17%
1 Jan 1973 Jahr
29.49
+1.019
3.58%
1 Jan 1974 Jahr
28.689
-0.802
-2.72%
1 Jan 1975 Jahr
31.108
+2.42
8.43%
1 Jan 1976 Jahr
32.115
+1.006
3.23%
1 Jan 1977 Jahr
33.442
+1.327
4.13%
1 Jan 1978 Jahr
32.272
-1.17
-3.5%
1 Jan 1979 Jahr
34.448
+2.176
6.74%
1 Jan 1980 Jahr
34.682
+0.234
0.68%
1 Jan 1981 Jahr
37.462
+2.78
8.02%
1 Jan 1982 Jahr
38.346
+0.883
2.36%
1 Jan 1983 Jahr
41.386
+3.04
7.93%
1 Jan 1984 Jahr
41.689
+0.303
0.73%
1 Jan 1985 Jahr
42.432
+0.743
1.78%
1 Jan 1986 Jahr
46.504
+4.072
9.6%
1 Jan 1987 Jahr
50.175
+3.671
7.89%
1 Jan 1988 Jahr
50.022
-0.153
-0.3%
1 Jan 1989 Jahr
51.423
+1.401
2.8%
1 Jan 1990 Jahr
52.529
+1.106
2.15%
1 Jan 1991 Jahr
58.792
+6.263
11.92%
1 Jan 1992 Jahr
60.557
+1.766
3.0%
1 Jan 1993 Jahr
63.537
+2.98
4.92%
1 Jan 1994 Jahr
65.669
+2.132
3.35%
1 Jan 1995 Jahr
67.409
+1.739
2.65%
1 Jan 1996 Jahr
68.09
+0.682
1.01%
1 Jan 1997 Jahr
77.544
+9.454
13.88%
1 Jan 1998 Jahr
74.349
-3.194
-4.12%
1 Jan 1999 Jahr
79.949
+5.6
7.53%
1 Jan 2000 Jahr
80.504
+0.555
0.69%
1 Jan 2001 Jahr
80.426
-0.078
-0.1%
1 Jan 2002 Jahr
81.757
+1.331
1.65%
1 Jan 2003 Jahr
88.982
+7.225
8.84%
1 Jan 2004 Jahr
93.667
+4.685
5.26%
1 Jan 2005 Jahr
95.403
+1.736
1.85%
1 Jan 2006 Jahr
99.781
+4.378
4.59%
1 Jan 2007 Jahr
104.816
+5.034
5.05%
1 Jan 2008 Jahr
104.109
-0.707
-0.67%
1 Jan 2009 Jahr
104.048
-0.061
-0.06%
1 Jan 2010 Jahr
110.641
+6.593
6.34%
1 Jan 2011 Jahr
110.044
-0.597
-0.54%
1 Jan 2012 Jahr
113.772
+3.728
3.39%
1 Jan 2013 Jahr
116.575
+2.803
2.46%
1 Jan 2014 Jahr
118.444
+1.869
1.6%
Bewertung der Länder gemäß mit laufender Statistik nach Jahren


Kommentare: