29
/de/
de
AIzaSyAYiBZKx7MnpbEhh9jyipgxe19OcubqV5w
April 1, 2024
49334
Middle East & North Africa (excluding high income)
MNA
false
2
1
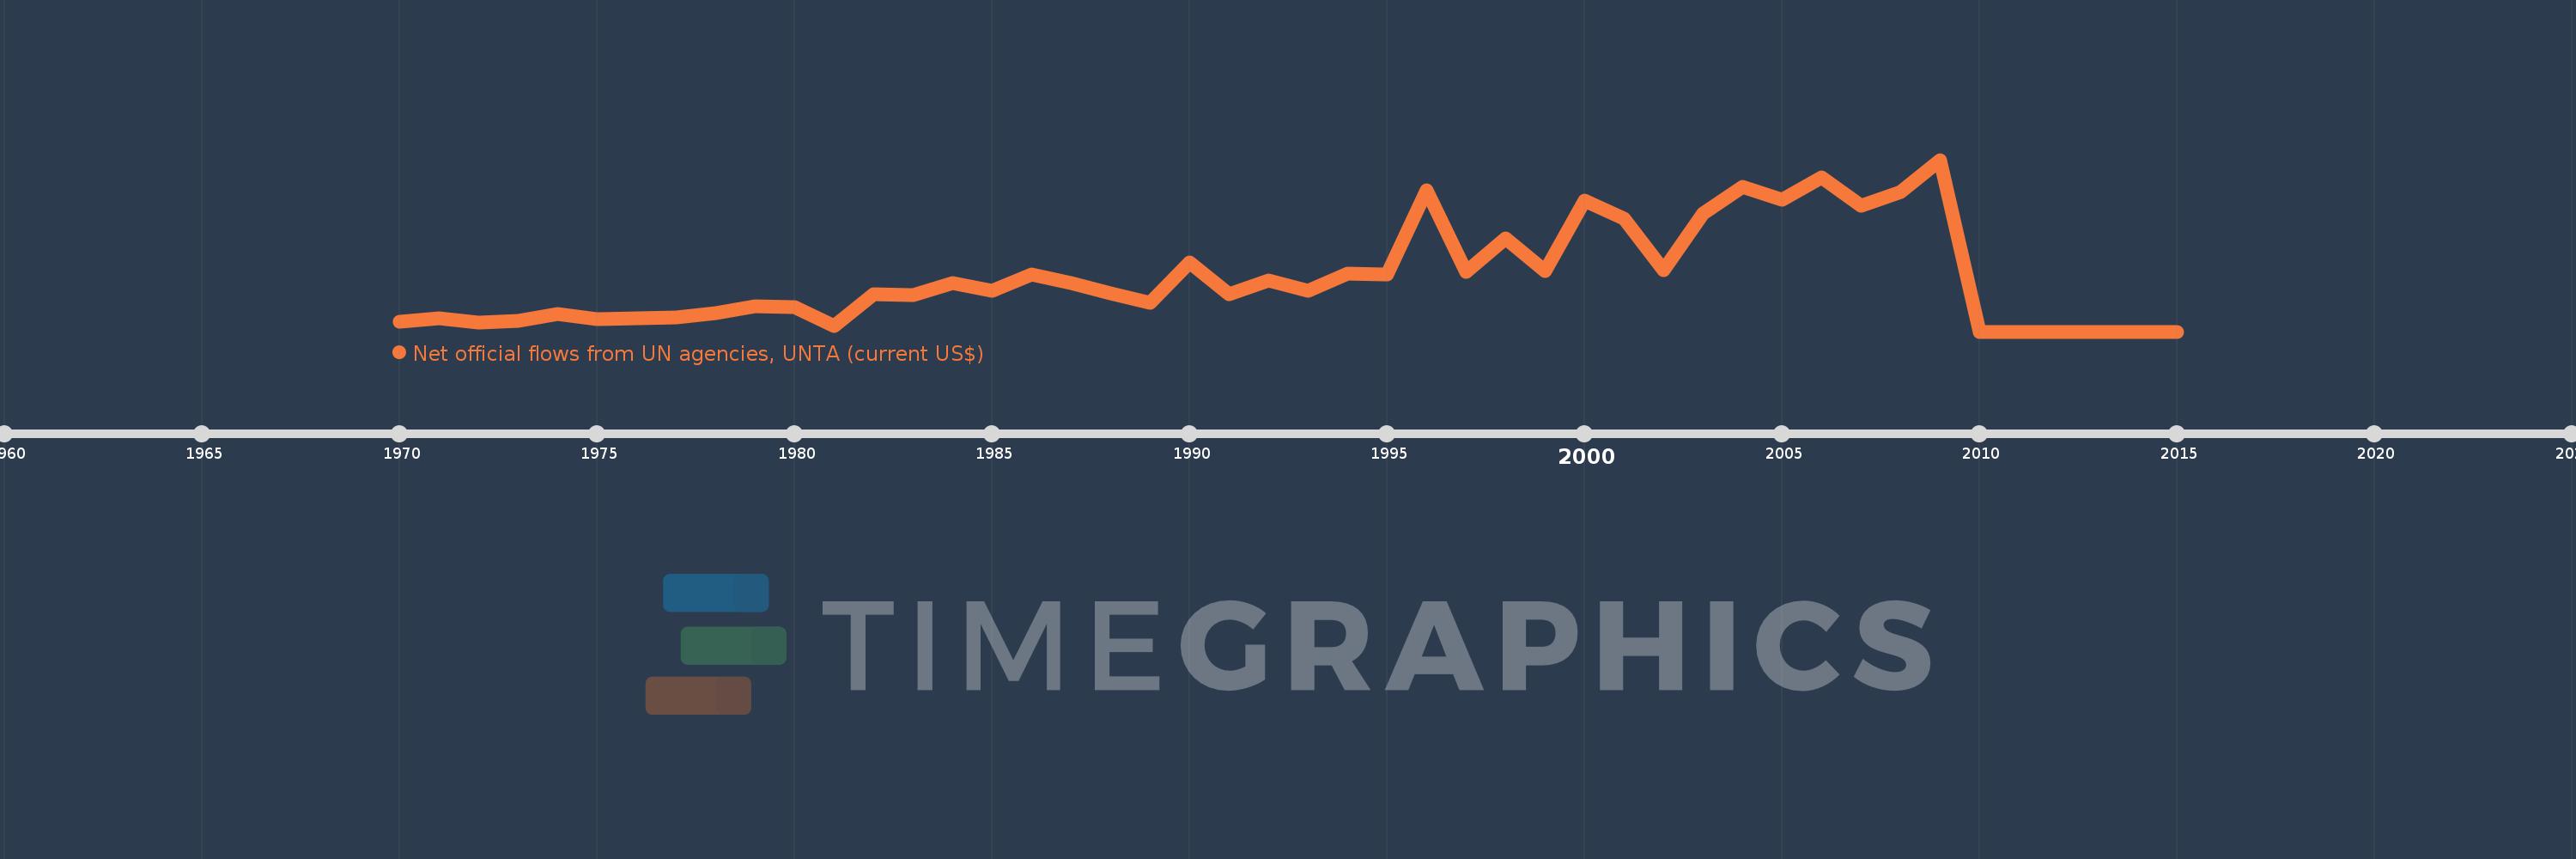
Net official flows from UN agencies, UNTA (current US$)
2015,2014,2013,2012,2011,2010,2009,2008,2007,2006,2005,2004,2003,2002,2001,2000,1999,1998,1997,1996,1995,1994,1993,1992,1991,1990,1989,1988,1987,1986,1985,1984,1983,1982,1981,1980,1979,1978,1977,1976,1975,1974,1973,1972,1971,1970
Diese Statistik in anderen Ländern:
AfghanistanAlbaniaAlgeriaAngolaAntigua and BarbudaArab WorldArgentinaArmeniaArubaAzerbaijanBahamas, TheBahrainBangladeshBarbadosBelarusBelizeBeninBermudaBhutanBoliviaBosnia and HerzegovinaBotswanaBrazilBritish Virgin IslandsBrunei DarussalamBulgariaBurkina FasoBurundiCabo VerdeCambodiaCameroonCaribbean small statesCayman IslandsCentral African RepublicCentral Europe and the BalticsChadChileChinaColombiaComorosCongo, Dem. Rep.Congo, Rep.Costa RicaCote d'IvoireCroatiaCubaCyprusCzech RepublicDjiboutiDominicaDominican RepublicEast Asia & PacificEast Asia & Pacific (excluding high income)East Asia & Pacific (IDA & IBRD countries)EcuadorEgypt, Arab Rep.El SalvadorEquatorial GuineaEritreaEstoniaEthiopiaEuro areaEurope & Central AsiaEurope & Central Asia (excluding high income)Europe & Central Asia (IDA & IBRD countries)European UnionFijiFragile and conflict affected situationsFrench PolynesiaGabonGambia, TheGeorgiaGhanaGrenadaGuatemalaGuineaGuinea-BissauGuyanaHaitiHeavily indebted poor countries (HIPC)High incomeHondurasHong Kong SAR, ChinaHungaryIBRD onlyIDA & IBRD totalIDA blendIDA onlyIDA totalIndiaIndonesiaIran, Islamic Rep.IraqIsraelJamaicaJordanKazakhstanKenyaKiribatiKorea, Dem. People’s Rep.Korea, Rep.KuwaitKyrgyz RepublicLao PDRLatin America & Caribbean Latin America & Caribbean (excluding high income)Latin America & the Caribbean (IDA & IBRD countries)LatviaLeast developed countries: UN classificationLebanonLesothoLiberiaLibyaLithuaniaLow & middle incomeLow incomeLower middle incomeMacao SAR, ChinaMacedonia, FYRMadagascarMalawiMalaysiaMaldivesMaliMaltaMarshall IslandsMauritaniaMauritiusMexicoMicronesia, Fed. Sts.Middle East & North AfricaMiddle East & North Africa (excluding high income)Middle East & North Africa (IDA & IBRD countries)Middle incomeMoldovaMongoliaMontenegroMoroccoMozambiqueMyanmarNamibiaNauruNepalNew CaledoniaNicaraguaNigerNigeriaNorth AmericaNorthern Mariana IslandsOECD membersOmanOther small statesPacific island small statesPakistanPalauPanamaPapua New GuineaParaguayPeruPhilippinesPolandQatarRomaniaRussian FederationRwandaSamoaSao Tome and PrincipeSaudi ArabiaSenegalSerbiaSeychellesSierra LeoneSingaporeSlovak RepublicSloveniaSmall statesSolomon IslandsSomaliaSouth AfricaSouth AsiaSouth Asia (IDA & IBRD)Sri LankaSt. Kitts and NevisSt. LuciaSt. Vincent and the GrenadinesSub-Saharan Africa Sub-Saharan Africa (excluding high income)Sub-Saharan Africa (IDA & IBRD countries)SudanSurinameSwazilandSyrian Arab RepublicTajikistanTanzaniaThailandTimor-LesteTogoTongaTrinidad and TobagoTunisiaTurkeyTurkmenistanTurks and Caicos IslandsTuvaluUgandaUkraineUnited Arab EmiratesUpper middle incomeUruguayUzbekistanVanuatuVenezuela, RBVietnamWest Bank and GazaWorldYemen, Rep.ZambiaZimbabwe Zeitlinie:
Diese Zeitleiste vorliegt die Graphik ab 1970 J. bis 2015 J. Middle East & North Africa (excluding high income). Die Angaben bis 1969 J. sind nicht vorhanden. Die Zahl aktueller Beobachtungen nach Daten: 46.
Die Quelle (Bezeichnung):
Kennzahlen der Weltentwicklung
Die Quelle (Einrichtung):
Development Assistance Committee of the Organisation for Economic Co-operation and Development, Geographical Distribution of Financial Flows to Developing Countries, Development Co-operation Report, and International Development Statistics database. Data are available online at: www.oecd.org/dac/stats/idsonline.
Kategorien:
Aid Effectiveness
Es wurde aktualisiert:
23 Apr 2017 Jahr
Kennzahlen der Wertänderungen vom Jahr zum Jahr
im Durchschnitt:
22.482 Mln.
Minimum:
0.0
1 Jan 2010 Jahr
Maximum:
71.86 Mln.
1 Jan 2009 Jahr
Zum Datum der Beobachtung
Wert
Absolute Veränderung
Die Veränderung bezüglich dem vorherigen Wert
1 Jan 1970 Jahr
4.21 Mln.
+4.21 Mln.
0.0%
1 Jan 1971 Jahr
5.64 Mln.
+1.43 Mln.
33.97%
1 Jan 1972 Jahr
3.88 Mln.
-1.76 Mln.
-31.21%
1 Jan 1973 Jahr
4.57 Mln.
+690.0 Tsnd.
17.78%
1 Jan 1974 Jahr
7.25 Mln.
+2.68 Mln.
58.64%
1 Jan 1975 Jahr
5.37 Mln.
-1.88 Mln.
-25.93%
1 Jan 1976 Jahr
5.49 Mln.
+120.0 Tsnd.
2.23%
1 Jan 1977 Jahr
6.1 Mln.
+610.0 Tsnd.
11.11%
1 Jan 1978 Jahr
7.64 Mln.
+1.54 Mln.
25.25%
1 Jan 1979 Jahr
10.74 Mln.
+3.1 Mln.
40.58%
1 Jan 1980 Jahr
10.17 Mln.
-570.0 Tsnd.
-5.31%
1 Jan 1981 Jahr
2.4 Mln.
-7.77 Mln.
-76.4%
1 Jan 1982 Jahr
15.73 Mln.
+13.33 Mln.
555.42%
1 Jan 1983 Jahr
15.2 Mln.
-530.0 Tsnd.
-3.37%
1 Jan 1984 Jahr
20.25 Mln.
+5.05 Mln.
33.22%
1 Jan 1985 Jahr
17.19 Mln.
-3.06 Mln.
-15.11%
1 Jan 1986 Jahr
23.8 Mln.
+6.61 Mln.
38.45%
1 Jan 1987 Jahr
20.38 Mln.
-3.42 Mln.
-14.37%
1 Jan 1988 Jahr
15.85 Mln.
-4.53 Mln.
-22.23%
1 Jan 1989 Jahr
12.13 Mln.
-3.72 Mln.
-23.47%
1 Jan 1990 Jahr
29.09 Mln.
+16.96 Mln.
139.82%
1 Jan 1991 Jahr
15.77 Mln.
-13.32 Mln.
-45.79%
1 Jan 1992 Jahr
21.33 Mln.
+5.56 Mln.
35.26%
1 Jan 1993 Jahr
16.96 Mln.
-4.37 Mln.
-20.49%
1 Jan 1994 Jahr
24.28 Mln.
+7.32 Mln.
43.16%
1 Jan 1995 Jahr
23.96 Mln.
-320.0 Tsnd.
-1.32%
1 Jan 1996 Jahr
58.99 Mln.
+35.03 Mln.
146.2%
1 Jan 1997 Jahr
24.92 Mln.
-34.07 Mln.
-57.76%
1 Jan 1998 Jahr
38.84 Mln.
+13.92 Mln.
55.86%
1 Jan 1999 Jahr
25.47 Mln.
-13.37 Mln.
-34.42%
1 Jan 2000 Jahr
54.96 Mln.
+29.49 Mln.
115.78%
1 Jan 2001 Jahr
47.18 Mln.
-7.78 Mln.
-14.16%
1 Jan 2002 Jahr
25.53 Mln.
-21.65 Mln.
-45.89%
1 Jan 2003 Jahr
49.57 Mln.
+24.04 Mln.
94.16%
1 Jan 2004 Jahr
60.72 Mln.
+11.15 Mln.
22.49%
1 Jan 2005 Jahr
55.27 Mln.
-5.45 Mln.
-8.98%
1 Jan 2006 Jahr
64.41 Mln.
+9.14 Mln.
16.54%
1 Jan 2007 Jahr
52.66 Mln.
-11.75 Mln.
-18.24%
1 Jan 2008 Jahr
58.41 Mln.
+5.75 Mln.
10.92%
1 Jan 2009 Jahr
71.86 Mln.
+13.45 Mln.
23.03%
1 Jan 2010 Jahr
0.0
-71.86 Mln.
-100.0%
Bewertung der Länder gemäß mit laufender Statistik nach Jahren


Kommentare: