29
/de/
de
AIzaSyAYiBZKx7MnpbEhh9jyipgxe19OcubqV5w
April 1, 2024
48660
Middle East & North Africa
MEA
false
2
1
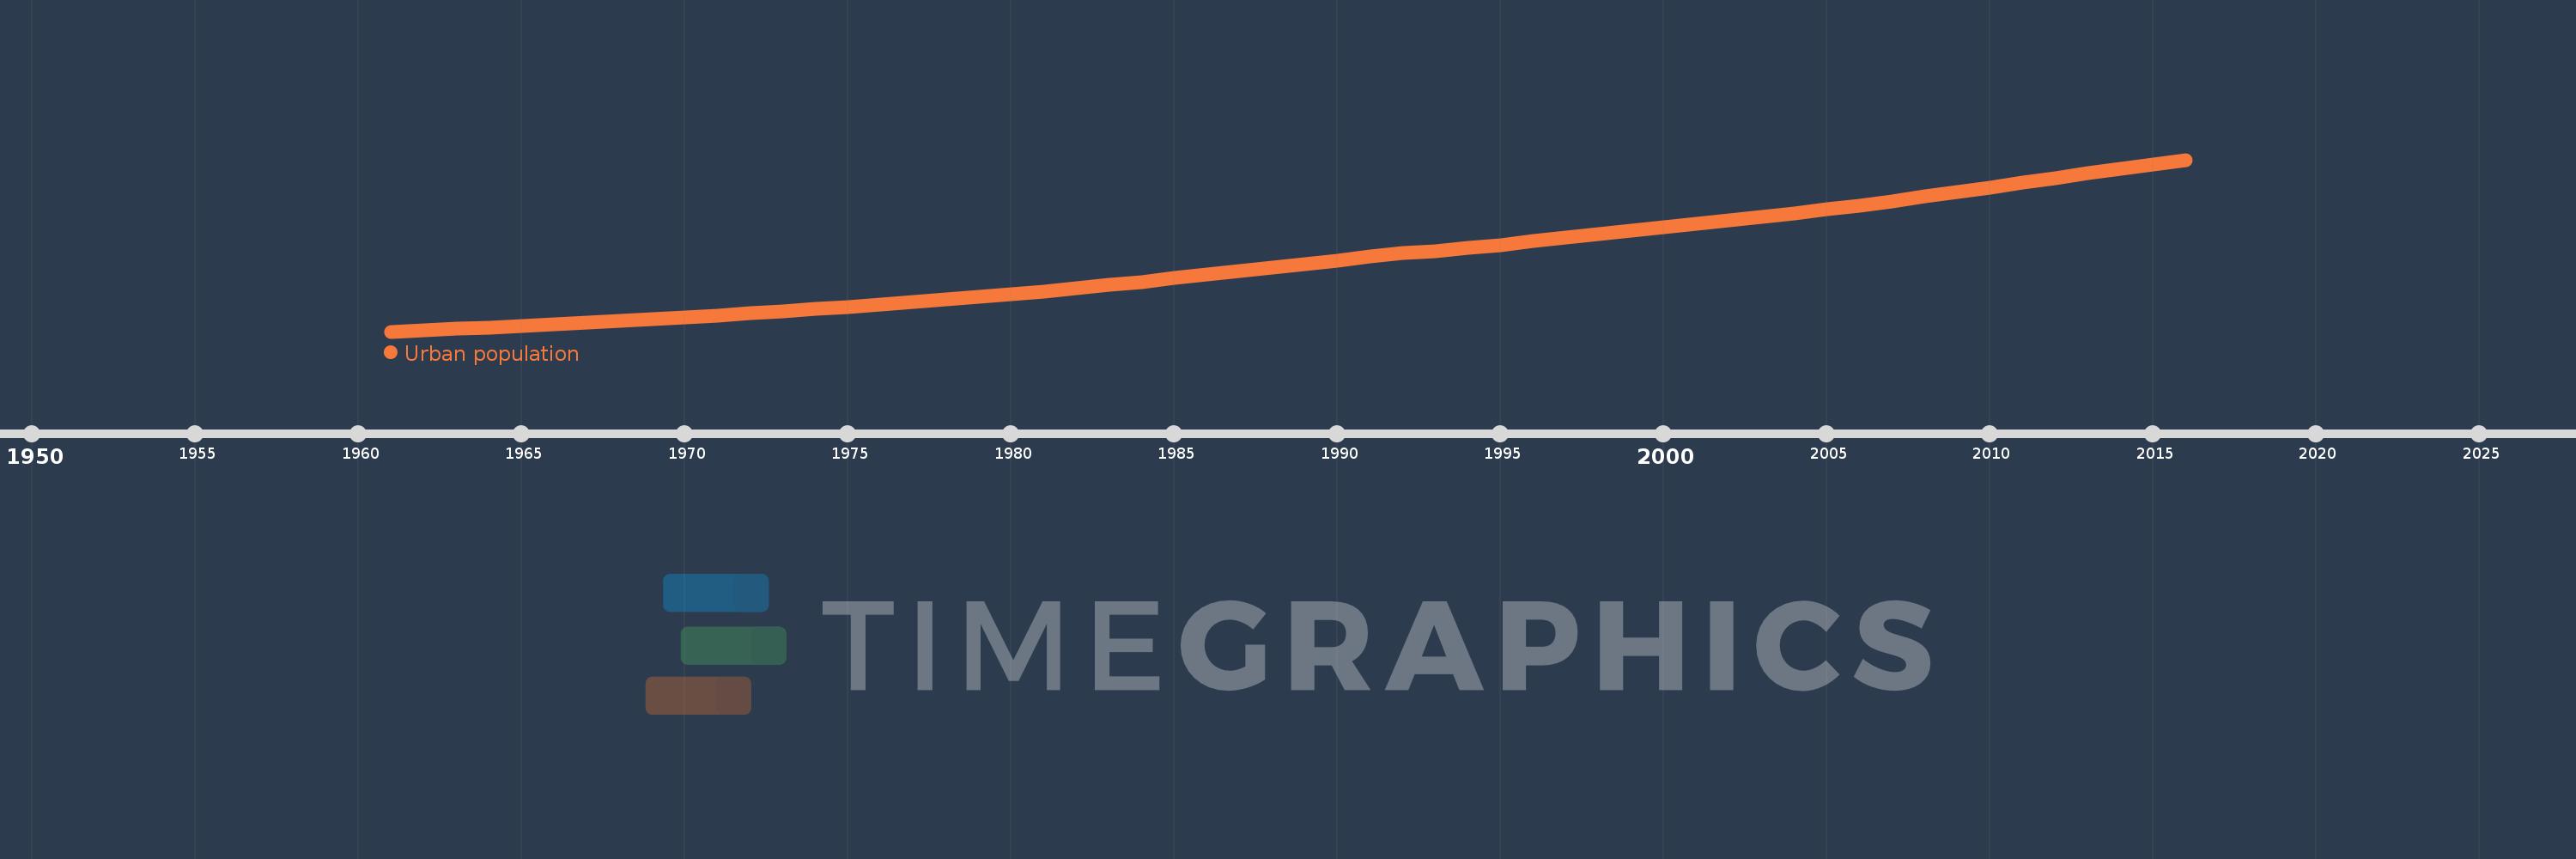
Urban population
2016,2015,2014,2013,2012,2011,2010,2009,2008,2007,2006,2005,2004,2003,2002,2001,2000,1999,1998,1997,1996,1995,1994,1993,1992,1991,1990,1989,1988,1987,1986,1985,1984,1983,1982,1981,1980,1979,1978,1977,1976,1975,1974,1973,1972,1971,1970,1969,1968,1967,1966,1965,1964,1963,1962,1961
Diese Statistik in anderen Ländern:
AfghanistanAlbaniaAlgeriaAmerican SamoaAndorraAngolaAntigua and BarbudaArab WorldArgentinaArmeniaArubaAustraliaAustriaAzerbaijanBahamas, TheBahrainBangladeshBarbadosBelarusBelgiumBelizeBeninBermudaBhutanBoliviaBosnia and HerzegovinaBotswanaBrazilBritish Virgin IslandsBrunei DarussalamBulgariaBurkina FasoBurundiCabo VerdeCambodiaCameroonCanadaCaribbean small statesCayman IslandsCentral African RepublicCentral Europe and the BalticsChadChannel IslandsChileChinaColombiaComorosCongo, Dem. Rep.Congo, Rep.Costa RicaCote d'IvoireCroatiaCubaCuracaoCyprusCzech RepublicDenmarkDjiboutiDominicaDominican RepublicEarly-demographic dividendEast Asia & PacificEast Asia & Pacific (excluding high income)East Asia & Pacific (IDA & IBRD countries)EcuadorEgypt, Arab Rep.El SalvadorEquatorial GuineaEritreaEstoniaEthiopiaEuro areaEurope & Central AsiaEurope & Central Asia (excluding high income)Europe & Central Asia (IDA & IBRD countries)European UnionFaroe IslandsFijiFinlandFragile and conflict affected situationsFranceFrench PolynesiaGabonGambia, TheGeorgiaGermanyGhanaGibraltarGreeceGreenlandGrenadaGuamGuatemalaGuineaGuinea-BissauGuyanaHaitiHeavily indebted poor countries (HIPC)High incomeHondurasHong Kong SAR, ChinaHungaryIBRD onlyIcelandIDA & IBRD totalIDA blendIDA onlyIDA totalIndiaIndonesiaIran, Islamic Rep.IraqIrelandIsle of ManIsraelItalyJamaicaJapanJordanKazakhstanKenyaKiribatiKorea, Dem. People’s Rep.Korea, Rep.KuwaitKyrgyz RepublicLao PDRLate-demographic dividendLatin America & Caribbean Latin America & Caribbean (excluding high income)Latin America & the Caribbean (IDA & IBRD countries)LatviaLeast developed countries: UN classificationLebanonLesothoLiberiaLibyaLiechtensteinLithuaniaLow & middle incomeLow incomeLower middle incomeLuxembourgMacao SAR, ChinaMacedonia, FYRMadagascarMalawiMalaysiaMaldivesMaliMaltaMarshall IslandsMauritaniaMauritiusMexicoMicronesia, Fed. Sts.Middle East & North AfricaMiddle East & North Africa (excluding high income)Middle East & North Africa (IDA & IBRD countries)Middle incomeMoldovaMonacoMongoliaMontenegroMoroccoMozambiqueMyanmarNamibiaNauruNepalNetherlandsNew CaledoniaNew ZealandNicaraguaNigerNigeriaNorth AmericaNorthern Mariana IslandsNorwayOECD membersOmanOther small statesPacific island small statesPakistanPalauPanamaPapua New GuineaParaguayPeruPhilippinesPolandPortugalPost-demographic dividendPre-demographic dividendPuerto RicoQatarRomaniaRussian FederationRwandaSamoaSan MarinoSao Tome and PrincipeSaudi ArabiaSenegalSerbiaSeychellesSierra LeoneSingaporeSint Maarten (Dutch part)Slovak RepublicSloveniaSmall statesSolomon IslandsSomaliaSouth AfricaSouth AsiaSouth Asia (IDA & IBRD)South SudanSpainSri LankaSt. Kitts and NevisSt. LuciaSt. Vincent and the GrenadinesSub-Saharan Africa Sub-Saharan Africa (excluding high income)Sub-Saharan Africa (IDA & IBRD countries)SudanSurinameSwazilandSwedenSwitzerlandSyrian Arab RepublicTajikistanTanzaniaThailandTimor-LesteTogoTongaTrinidad and TobagoTunisiaTurkeyTurkmenistanTurks and Caicos IslandsTuvaluUgandaUkraineUnited Arab EmiratesUnited KingdomUnited StatesUpper middle incomeUruguayUzbekistanVanuatuVenezuela, RBVietnamVirgin Islands (U.S.)West Bank and GazaWorldYemen, Rep.ZambiaZimbabwe Zeitlinie:
Diese Zeitleiste vorliegt die Graphik ab 1961 J. bis 2016 J. Middle East & North Africa. Die Angaben bis 1960 J. sind nicht vorhanden. Die Zahl aktueller Beobachtungen nach Daten: 56.
Die Quelle (Bezeichnung):
Kennzahlen der Weltentwicklung
Die Quelle (Einrichtung):
World Bank Staff estimates based on United Nations, World Urbanization Prospects.
Kategorien:
Climate Change, Urban Development
Es wurde aktualisiert:
23 Apr 2017 Jahr
Kennzahlen der Wertänderungen vom Jahr zum Jahr
im Durchschnitt:
134.402 Mln.
Minimum:
36.901 Mln.
1 Jan 1961 Jahr
Maximum:
272.327 Mln.
1 Jan 2016 Jahr
Zum Datum der Beobachtung
Wert
Absolute Veränderung
Die Veränderung bezüglich dem vorherigen Wert
1 Jan 1961 Jahr
36.901 Mln.
+36.901 Mln.
0.0%
1 Jan 1962 Jahr
38.724 Mln.
+1.823 Mln.
4.94%
1 Jan 1963 Jahr
40.653 Mln.
+1.929 Mln.
4.98%
1 Jan 1964 Jahr
42.668 Mln.
+2.016 Mln.
4.96%
1 Jan 1965 Jahr
44.806 Mln.
+2.138 Mln.
5.01%
1 Jan 1966 Jahr
47.068 Mln.
+2.262 Mln.
5.05%
1 Jan 1967 Jahr
49.361 Mln.
+2.293 Mln.
4.87%
1 Jan 1968 Jahr
51.697 Mln.
+2.336 Mln.
4.73%
1 Jan 1969 Jahr
54.101 Mln.
+2.405 Mln.
4.65%
1 Jan 1970 Jahr
56.608 Mln.
+2.507 Mln.
4.63%
1 Jan 1971 Jahr
59.226 Mln.
+2.618 Mln.
4.62%
1 Jan 1972 Jahr
61.896 Mln.
+2.67 Mln.
4.51%
1 Jan 1973 Jahr
64.667 Mln.
+2.772 Mln.
4.48%
1 Jan 1974 Jahr
67.6 Mln.
+2.933 Mln.
4.54%
1 Jan 1975 Jahr
70.62 Mln.
+3.02 Mln.
4.47%
1 Jan 1976 Jahr
73.766 Mln.
+3.146 Mln.
4.45%
1 Jan 1977 Jahr
77.075 Mln.
+3.309 Mln.
4.49%
1 Jan 1978 Jahr
80.48 Mln.
+3.405 Mln.
4.42%
1 Jan 1979 Jahr
84.045 Mln.
+3.565 Mln.
4.43%
1 Jan 1980 Jahr
87.825 Mln.
+3.78 Mln.
4.5%
1 Jan 1981 Jahr
91.842 Mln.
+4.017 Mln.
4.57%
1 Jan 1982 Jahr
96.081 Mln.
+4.239 Mln.
4.62%
1 Jan 1983 Jahr
100.528 Mln.
+4.447 Mln.
4.63%
1 Jan 1984 Jahr
105.157 Mln.
+4.629 Mln.
4.6%
1 Jan 1985 Jahr
109.888 Mln.
+4.731 Mln.
4.5%
1 Jan 1986 Jahr
114.761 Mln.
+4.873 Mln.
4.43%
1 Jan 1987 Jahr
119.738 Mln.
+4.977 Mln.
4.34%
1 Jan 1988 Jahr
124.582 Mln.
+4.844 Mln.
4.05%
1 Jan 1989 Jahr
129.27 Mln.
+4.688 Mln.
3.76%
1 Jan 1990 Jahr
133.793 Mln.
+4.523 Mln.
3.5%
1 Jan 1991 Jahr
139.648 Mln.
+5.855 Mln.
4.38%
1 Jan 1992 Jahr
144.195 Mln.
+4.547 Mln.
3.26%
1 Jan 1993 Jahr
146.787 Mln.
+2.592 Mln.
1.8%
1 Jan 1994 Jahr
151.205 Mln.
+4.418 Mln.
3.01%
1 Jan 1995 Jahr
155.664 Mln.
+4.459 Mln.
2.95%
1 Jan 1996 Jahr
161.617 Mln.
+5.953 Mln.
3.82%
1 Jan 1997 Jahr
165.976 Mln.
+4.359 Mln.
2.7%
1 Jan 1998 Jahr
170.464 Mln.
+4.488 Mln.
2.7%
1 Jan 1999 Jahr
175.061 Mln.
+4.597 Mln.
2.7%
1 Jan 2000 Jahr
179.764 Mln.
+4.703 Mln.
2.69%
1 Jan 2001 Jahr
184.511 Mln.
+4.747 Mln.
2.64%
1 Jan 2002 Jahr
189.284 Mln.
+4.774 Mln.
2.59%
1 Jan 2003 Jahr
194.095 Mln.
+4.81 Mln.
2.54%
1 Jan 2004 Jahr
199.026 Mln.
+4.931 Mln.
2.54%
1 Jan 2005 Jahr
204.202 Mln.
+5.176 Mln.
2.6%
1 Jan 2006 Jahr
209.728 Mln.
+5.526 Mln.
2.71%
1 Jan 2007 Jahr
215.612 Mln.
+5.884 Mln.
2.81%
1 Jan 2008 Jahr
221.737 Mln.
+6.125 Mln.
2.84%
1 Jan 2009 Jahr
228.059 Mln.
+6.322 Mln.
2.85%
1 Jan 2010 Jahr
234.507 Mln.
+6.448 Mln.
2.83%
1 Jan 2011 Jahr
240.893 Mln.
+6.386 Mln.
2.72%
1 Jan 2012 Jahr
247.241 Mln.
+6.349 Mln.
2.64%
1 Jan 2013 Jahr
253.553 Mln.
+6.312 Mln.
2.55%
1 Jan 2014 Jahr
259.831 Mln.
+6.278 Mln.
2.48%
1 Jan 2015 Jahr
266.086 Mln.
+6.255 Mln.
2.41%
1 Jan 2016 Jahr
272.327 Mln.
+6.242 Mln.
2.35%
Bewertung der Länder gemäß mit laufender Statistik nach Jahren


Kommentare: