29
/de/
de
AIzaSyAYiBZKx7MnpbEhh9jyipgxe19OcubqV5w
April 1, 2024
48034
Middle East & North Africa
MEA
false
2
1
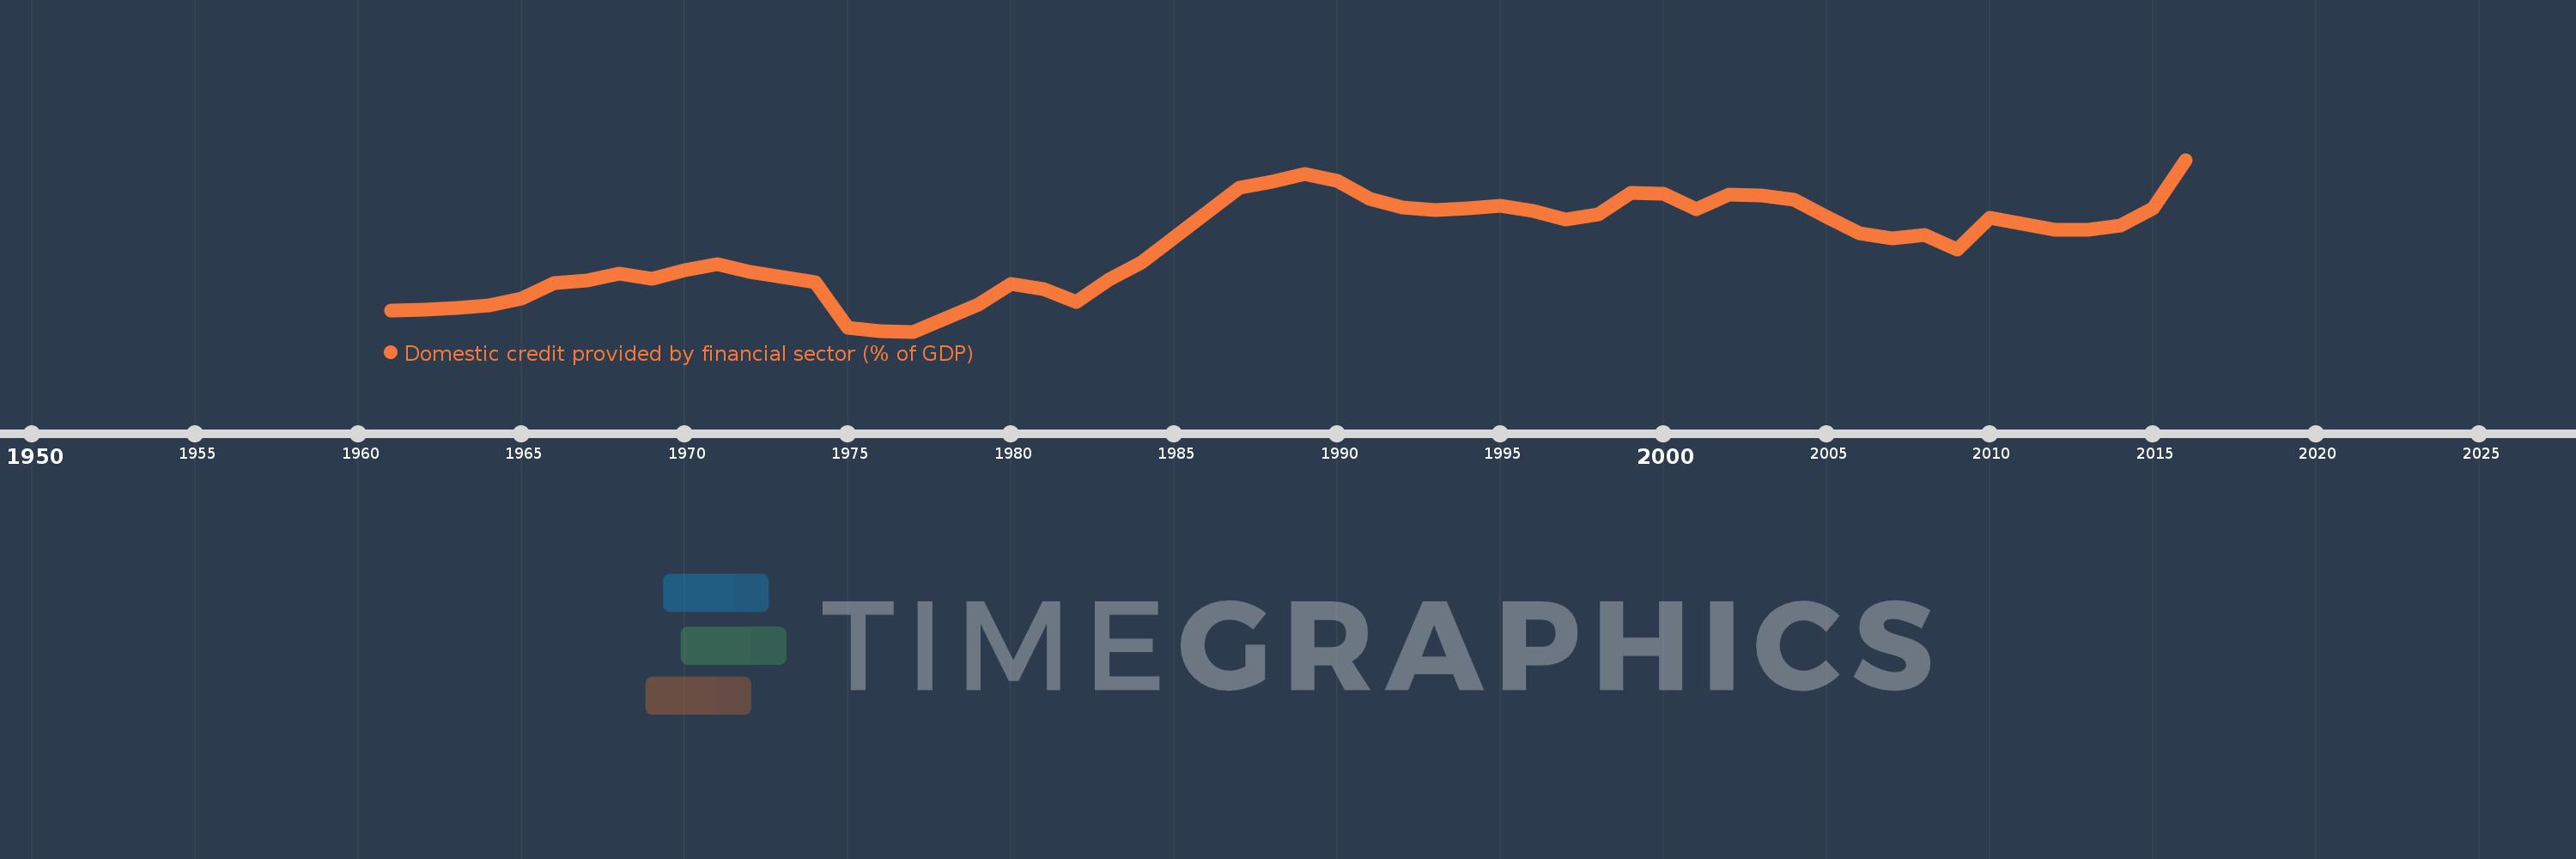
Domestic credit provided by financial sector (% of GDP)
2016,2015,2014,2013,2012,2011,2010,2009,2008,2007,2006,2005,2004,2003,2002,2001,2000,1999,1998,1997,1996,1995,1994,1993,1992,1991,1990,1989,1988,1987,1984,1983,1982,1981,1980,1979,1978,1977,1976,1975,1974,1973,1972,1971,1970,1969,1968,1967,1966,1965,1964,1963,1962,1961
Diese Statistik in anderen Ländern:
AfghanistanAlbaniaAlgeriaAngolaAntigua and BarbudaArab WorldArgentinaArmeniaArubaAustraliaAustriaAzerbaijanBahamas, TheBahrainBangladeshBarbadosBelarusBelgiumBelizeBeninBhutanBoliviaBosnia and HerzegovinaBotswanaBrazilBrunei DarussalamBulgariaBurkina FasoBurundiCabo VerdeCambodiaCameroonCanadaCaribbean small statesCentral African RepublicCentral Europe and the BalticsChadChileChinaColombiaComorosCongo, Dem. Rep.Congo, Rep.Costa RicaCote d'IvoireCroatiaCyprusCzech RepublicDenmarkDjiboutiDominicaDominican RepublicEarly-demographic dividendEast Asia & PacificEast Asia & Pacific (excluding high income)East Asia & Pacific (IDA & IBRD countries)EcuadorEgypt, Arab Rep.El SalvadorEquatorial GuineaEritreaEstoniaEthiopiaEuro areaEurope & Central AsiaEurope & Central Asia (excluding high income)Europe & Central Asia (IDA & IBRD countries)European UnionFijiFinlandFragile and conflict affected situationsFranceGabonGambia, TheGeorgiaGermanyGhanaGreeceGrenadaGuatemalaGuineaGuinea-BissauGuyanaHaitiHeavily indebted poor countries (HIPC)High incomeHondurasHong Kong SAR, ChinaHungaryIBRD onlyIcelandIDA & IBRD totalIDA blendIDA onlyIDA totalIndiaIndonesiaIran, Islamic Rep.IraqIrelandIsraelItalyJamaicaJapanJordanKazakhstanKenyaKorea, Rep.KosovoKuwaitKyrgyz RepublicLao PDRLate-demographic dividendLatin America & Caribbean Latin America & Caribbean (excluding high income)Latin America & the Caribbean (IDA & IBRD countries)LatviaLeast developed countries: UN classificationLebanonLesothoLiberiaLibyaLithuaniaLow & middle incomeLow incomeLower middle incomeLuxembourgMacao SAR, ChinaMacedonia, FYRMadagascarMalawiMalaysiaMaldivesMaliMaltaMauritaniaMauritiusMexicoMicronesia, Fed. Sts.Middle East & North AfricaMiddle East & North Africa (excluding high income)Middle East & North Africa (IDA & IBRD countries)Middle incomeMoldovaMongoliaMontenegroMoroccoMozambiqueMyanmarNamibiaNepalNetherlandsNew ZealandNicaraguaNigerNigeriaNorth AmericaNorwayOECD membersOmanOther small statesPacific island small statesPakistanPanamaPapua New GuineaParaguayPeruPhilippinesPolandPortugalPost-demographic dividendPre-demographic dividendQatarRomaniaRussian FederationRwandaSamoaSao Tome and PrincipeSaudi ArabiaSenegalSerbiaSeychellesSierra LeoneSingaporeSlovak RepublicSloveniaSmall statesSolomon IslandsSouth AfricaSouth AsiaSouth Asia (IDA & IBRD)South SudanSpainSri LankaSt. Kitts and NevisSt. LuciaSt. Vincent and the GrenadinesSub-Saharan Africa Sub-Saharan Africa (excluding high income)Sub-Saharan Africa (IDA & IBRD countries)SudanSurinameSwazilandSwedenSwitzerlandSyrian Arab RepublicTajikistanTanzaniaThailandTimor-LesteTogoTongaTrinidad and TobagoTunisiaTurkeyUgandaUkraineUnited Arab EmiratesUnited KingdomUnited StatesUpper middle incomeUruguayVanuatuVenezuela, RBVietnamWest Bank and GazaWorldYemen, Rep.ZambiaZimbabwe Zeitlinie:
Diese Zeitleiste vorliegt die Graphik ab 1961 J. bis 2016 J. Middle East & North Africa. Die Angaben bis 1960 J. sind nicht vorhanden. Die Zahl aktueller Beobachtungen nach Daten: 54.
Die Quelle (Bezeichnung):
Kennzahlen der Weltentwicklung
Die Quelle (Einrichtung):
International Monetary Fund, International Financial Statistics and data files, and World Bank and OECD GDP estimates.
Kategorien:
Financial Sector
Es wurde aktualisiert:
23 Apr 2017 Jahr
Kennzahlen der Wertänderungen vom Jahr zum Jahr
Minimum:
11.964
1 Jan 1977 Jahr
Maximum:
69.43
1 Jan 2016 Jahr
Zum Datum der Beobachtung
Wert
Absolute Veränderung
Die Veränderung bezüglich dem vorherigen Wert
1 Jan 1961 Jahr
19.0
+19.0
0.0%
1 Jan 1962 Jahr
19.406
+0.406
2.14%
1 Jan 1963 Jahr
19.809
+0.402
2.07%
1 Jan 1964 Jahr
20.818
+1.01
5.1%
1 Jan 1965 Jahr
23.103
+2.285
10.97%
1 Jan 1966 Jahr
28.241
+5.139
22.24%
1 Jan 1967 Jahr
29.116
+0.875
3.1%
1 Jan 1968 Jahr
31.307
+2.191
7.52%
1 Jan 1969 Jahr
29.685
-1.622
-5.18%
1 Jan 1970 Jahr
32.564
+2.879
9.7%
1 Jan 1971 Jahr
34.536
+1.972
6.06%
1 Jan 1972 Jahr
31.886
-2.649
-7.67%
1 Jan 1973 Jahr
30.335
-1.551
-4.86%
1 Jan 1974 Jahr
28.589
-1.746
-5.76%
1 Jan 1975 Jahr
13.343
-15.246
-53.33%
1 Jan 1976 Jahr
12.025
-1.318
-9.88%
1 Jan 1977 Jahr
11.964
-0.061
-0.51%
1 Jan 1978 Jahr
16.474
+4.51
37.7%
1 Jan 1979 Jahr
21.002
+4.528
27.49%
1 Jan 1980 Jahr
27.961
+6.959
33.13%
1 Jan 1981 Jahr
26.32
-1.641
-5.87%
1 Jan 1982 Jahr
21.806
-4.514
-17.15%
1 Jan 1983 Jahr
29.247
+7.442
34.13%
1 Jan 1984 Jahr
35.225
+5.977
20.44%
1 Jan 1987 Jahr
60.216
+24.991
70.95%
1 Jan 1988 Jahr
62.181
+1.965
3.26%
1 Jan 1989 Jahr
64.811
+2.63
4.23%
1 Jan 1990 Jahr
62.285
-2.526
-3.9%
1 Jan 1991 Jahr
56.28
-6.005
-9.64%
1 Jan 1992 Jahr
53.451
-2.829
-5.03%
1 Jan 1993 Jahr
52.514
-0.938
-1.75%
1 Jan 1994 Jahr
53.149
+0.636
1.21%
1 Jan 1995 Jahr
54.123
+0.974
1.83%
1 Jan 1996 Jahr
52.297
-1.826
-3.37%
1 Jan 1997 Jahr
49.581
-2.717
-5.19%
1 Jan 1998 Jahr
51.319
+1.738
3.51%
1 Jan 1999 Jahr
58.497
+7.179
13.99%
1 Jan 2000 Jahr
58.105
-0.392
-0.67%
1 Jan 2001 Jahr
52.971
-5.135
-8.84%
1 Jan 2002 Jahr
57.848
+4.877
9.21%
1 Jan 2003 Jahr
57.565
-0.283
-0.49%
1 Jan 2004 Jahr
56.018
-1.547
-2.69%
1 Jan 2005 Jahr
50.401
-5.617
-10.03%
1 Jan 2006 Jahr
44.925
-5.476
-10.86%
1 Jan 2007 Jahr
43.054
-1.871
-4.17%
1 Jan 2008 Jahr
44.229
+1.176
2.73%
1 Jan 2009 Jahr
39.539
-4.69
-10.6%
1 Jan 2010 Jahr
49.95
+10.41
26.33%
1 Jan 2011 Jahr
48.083
-1.867
-3.74%
1 Jan 2012 Jahr
46.082
-2.0
-4.16%
1 Jan 2013 Jahr
46.101
+0.019
0.04%
1 Jan 2014 Jahr
47.387
+1.286
2.79%
1 Jan 2015 Jahr
53.214
+5.827
12.3%
1 Jan 2016 Jahr
69.43
+16.216
30.47%
Bewertung der Länder gemäß mit laufender Statistik nach Jahren


Kommentare: