29
/de/
de
AIzaSyAYiBZKx7MnpbEhh9jyipgxe19OcubqV5w
April 1, 2024
46201
Low income
LIC
false
2
1
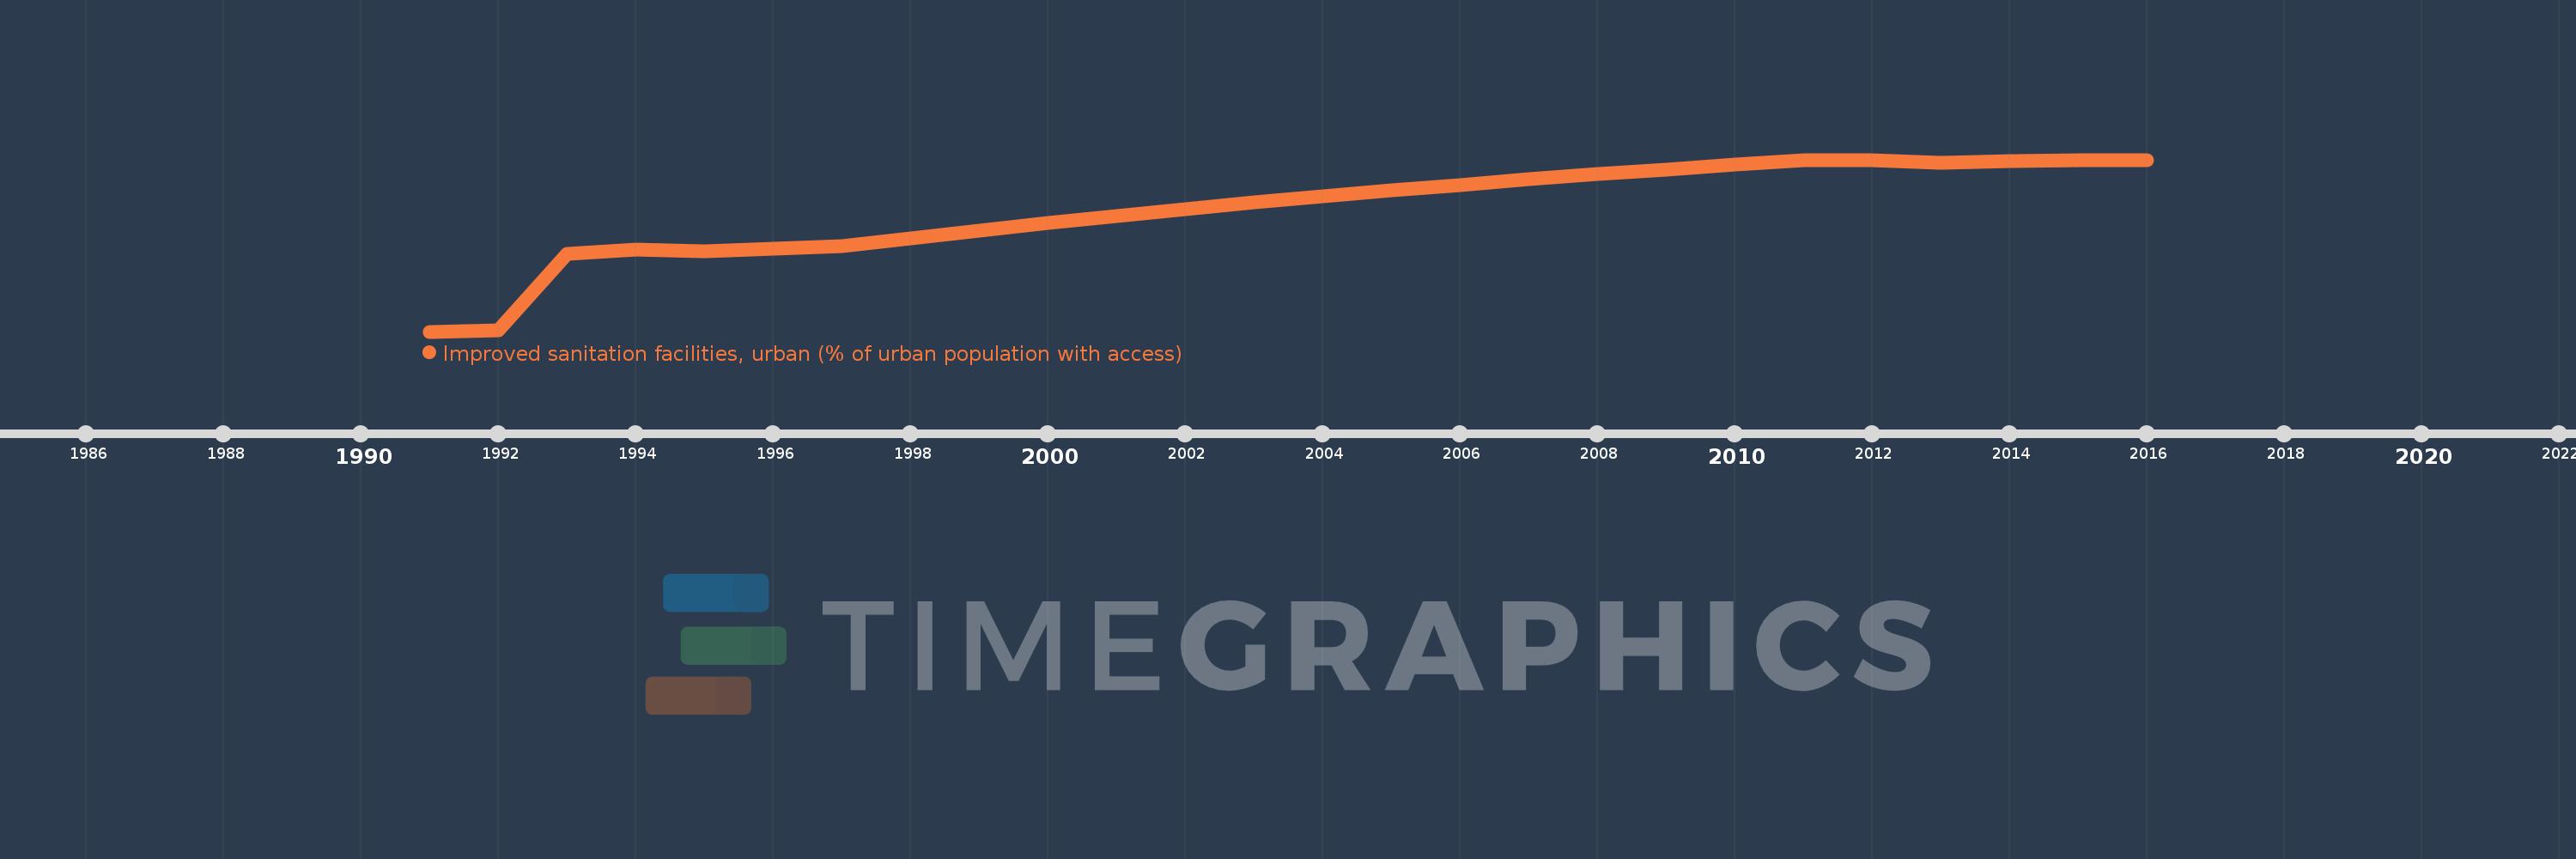
Improved sanitation facilities, urban (% of urban population with access)
2016,2015,2014,2013,2012,2011,2010,2009,2008,2007,2006,2005,2004,2003,2002,2001,2000,1999,1998,1997,1996,1995,1994,1993,1992,1991
Diese Statistik in anderen Ländern:
AfghanistanAlbaniaAlgeriaAmerican SamoaAndorraAngolaAntigua and BarbudaArab WorldArgentinaArmeniaArubaAustraliaAustriaAzerbaijanBahamas, TheBahrainBangladeshBarbadosBelarusBelgiumBelizeBeninBhutanBoliviaBosnia and HerzegovinaBotswanaBrazilBritish Virgin IslandsBulgariaBurkina FasoBurundiCabo VerdeCambodiaCameroonCanadaCaribbean small statesCayman IslandsCentral African RepublicCentral Europe and the BalticsChadChileChinaColombiaComorosCongo, Dem. Rep.Congo, Rep.Costa RicaCote d'IvoireCroatiaCubaCyprusCzech RepublicDenmarkDjiboutiDominicaDominican RepublicEarly-demographic dividendEast Asia & PacificEast Asia & Pacific (excluding high income)East Asia & Pacific (IDA & IBRD countries)EcuadorEgypt, Arab Rep.El SalvadorEquatorial GuineaEritreaEstoniaEthiopiaEuro areaEurope & Central AsiaEurope & Central Asia (excluding high income)Europe & Central Asia (IDA & IBRD countries)European UnionFijiFinlandFragile and conflict affected situationsFranceFrench PolynesiaGabonGambia, TheGeorgiaGermanyGhanaGreeceGreenlandGrenadaGuamGuatemalaGuineaGuinea-BissauGuyanaHaitiHeavily indebted poor countries (HIPC)High incomeHondurasHungaryIBRD onlyIcelandIDA & IBRD totalIDA blendIDA onlyIDA totalIndiaIndonesiaIran, Islamic Rep.IraqIrelandIsraelItalyJamaicaJapanJordanKazakhstanKenyaKiribatiKorea, Dem. People’s Rep.Korea, Rep.KuwaitKyrgyz RepublicLao PDRLate-demographic dividendLatin America & Caribbean Latin America & Caribbean (excluding high income)Latin America & the Caribbean (IDA & IBRD countries)LatviaLeast developed countries: UN classificationLebanonLesothoLiberiaLibyaLithuaniaLow & middle incomeLow incomeLower middle incomeLuxembourgMacedonia, FYRMadagascarMalawiMalaysiaMaldivesMaliMaltaMarshall IslandsMauritaniaMauritiusMexicoMicronesia, Fed. Sts.Middle East & North AfricaMiddle East & North Africa (excluding high income)Middle East & North Africa (IDA & IBRD countries)Middle incomeMoldovaMonacoMongoliaMontenegroMoroccoMozambiqueMyanmarNamibiaNauruNepalNetherlandsNew CaledoniaNicaraguaNigerNigeriaNorth AmericaNorthern Mariana IslandsNorwayOECD membersOmanOther small statesPacific island small statesPakistanPalauPanamaPapua New GuineaParaguayPeruPhilippinesPolandPortugalPost-demographic dividendPre-demographic dividendPuerto RicoQatarRomaniaRussian FederationRwandaSamoaSao Tome and PrincipeSaudi ArabiaSenegalSerbiaSeychellesSierra LeoneSingaporeSlovak RepublicSloveniaSmall statesSolomon IslandsSomaliaSouth AfricaSouth AsiaSouth Asia (IDA & IBRD)South SudanSpainSri LankaSt. Kitts and NevisSt. LuciaSt. Vincent and the GrenadinesSub-Saharan Africa Sub-Saharan Africa (excluding high income)Sub-Saharan Africa (IDA & IBRD countries)SudanSurinameSwazilandSwedenSwitzerlandSyrian Arab RepublicTajikistanTanzaniaThailandTimor-LesteTogoTongaTrinidad and TobagoTunisiaTurkeyTurkmenistanTurks and Caicos IslandsTuvaluUgandaUkraineUnited Arab EmiratesUnited KingdomUnited StatesUpper middle incomeUruguayUzbekistanVanuatuVenezuela, RBVietnamVirgin Islands (U.S.)West Bank and GazaWorldYemen, Rep.ZambiaZimbabwe Zeitlinie:
Diese Zeitleiste vorliegt die Graphik ab 1991 J. bis 2016 J. Low income. Die Angaben bis 1990 J. sind nicht vorhanden. Die Zahl aktueller Beobachtungen nach Daten: 26.
Die Quelle (Bezeichnung):
Kennzahlen der Weltentwicklung
Die Quelle (Einrichtung):
WHO/UNICEF Joint Monitoring Programme (JMP) for Water Supply and Sanitation (http://www.wssinfo.org/).
Kategorien:
Health, Urban Development
Es wurde aktualisiert:
23 Apr 2017 Jahr
Kennzahlen der Wertänderungen vom Jahr zum Jahr
Minimum:
28.718
1 Jan 1991 Jahr
Maximum:
39.67
1 Jan 2015 Jahr
Zum Datum der Beobachtung
Wert
Absolute Veränderung
Die Veränderung bezüglich dem vorherigen Wert
1 Jan 1991 Jahr
28.718
+28.718
0.0%
1 Jan 1992 Jahr
28.786
+0.068
0.24%
1 Jan 1993 Jahr
33.667
+4.881
16.96%
1 Jan 1994 Jahr
33.943
+0.276
0.82%
1 Jan 1995 Jahr
33.859
-0.084
-0.25%
1 Jan 1996 Jahr
33.993
+0.134
0.4%
1 Jan 1997 Jahr
34.166
+0.172
0.51%
1 Jan 1998 Jahr
34.642
+0.477
1.39%
1 Jan 1999 Jahr
35.15
+0.508
1.47%
1 Jan 2000 Jahr
35.626
+0.476
1.35%
1 Jan 2001 Jahr
36.077
+0.451
1.27%
1 Jan 2002 Jahr
36.537
+0.46
1.28%
1 Jan 2003 Jahr
36.958
+0.421
1.15%
1 Jan 2004 Jahr
37.331
+0.372
1.01%
1 Jan 2005 Jahr
37.709
+0.378
1.01%
1 Jan 2006 Jahr
38.072
+0.363
0.96%
1 Jan 2007 Jahr
38.426
+0.354
0.93%
1 Jan 2008 Jahr
38.769
+0.343
0.89%
1 Jan 2009 Jahr
39.063
+0.294
0.76%
1 Jan 2010 Jahr
39.352
+0.289
0.74%
1 Jan 2011 Jahr
39.648
+0.295
0.75%
1 Jan 2012 Jahr
39.658
+0.01
0.03%
1 Jan 2013 Jahr
39.481
-0.177
-0.45%
1 Jan 2014 Jahr
39.588
+0.107
0.27%
1 Jan 2015 Jahr
39.67
+0.081
0.21%
1 Jan 2016 Jahr
39.651
-0.018
-0.05%
Bewertung der Länder gemäß mit laufender Statistik nach Jahren


Kommentare: