29
/de/
de
AIzaSyAYiBZKx7MnpbEhh9jyipgxe19OcubqV5w
April 1, 2024
44545
Least developed countries: UN classification
LDC
false
2
1
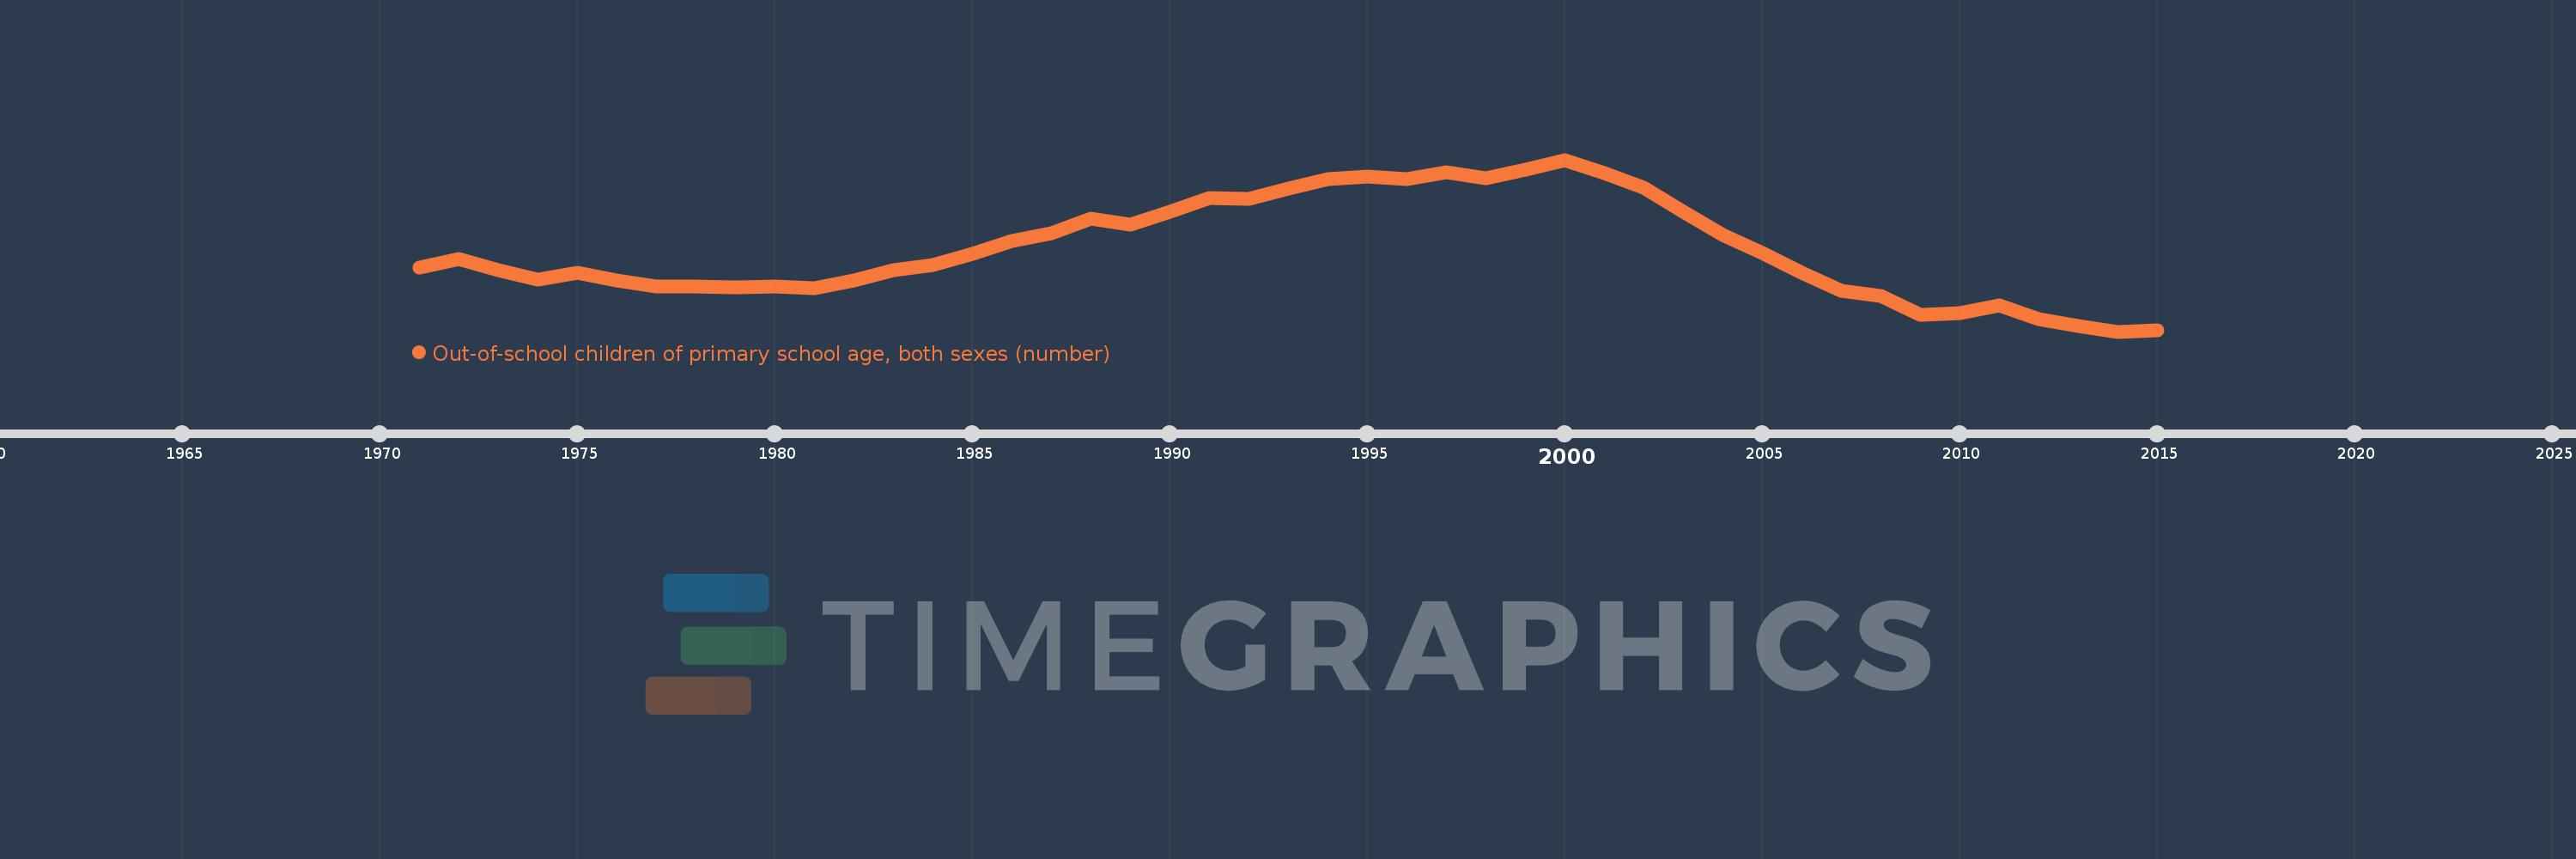
Out-of-school children of primary school age, both sexes (number)
2015,2014,2013,2012,2011,2010,2009,2008,2007,2006,2005,2004,2003,2002,2001,2000,1999,1998,1997,1996,1995,1994,1993,1992,1991,1990,1989,1988,1987,1986,1985,1984,1983,1982,1981,1980,1979,1978,1977,1976,1975,1974,1973,1972,1971
Diese Statistik in anderen Ländern:
AfghanistanAlbaniaAlgeriaAngolaAntigua and BarbudaArab WorldArgentinaArmeniaArubaAustraliaAustriaAzerbaijanBahamas, TheBahrainBangladeshBarbadosBelarusBelgiumBelizeBeninBermudaBhutanBoliviaBosnia and HerzegovinaBotswanaBrazilBrunei DarussalamBulgariaBurkina FasoBurundiCabo VerdeCambodiaCameroonCanadaCaribbean small statesCentral African RepublicCentral Europe and the BalticsChadChileChinaColombiaComorosCongo, Dem. Rep.Congo, Rep.Costa RicaCote d'IvoireCroatiaCubaCyprusDenmarkDjiboutiDominicaDominican RepublicEarly-demographic dividendEast Asia & PacificEast Asia & Pacific (excluding high income)East Asia & Pacific (IDA & IBRD countries)EcuadorEgypt, Arab Rep.El SalvadorEquatorial GuineaEritreaEstoniaEthiopiaEuro areaEurope & Central AsiaEurope & Central Asia (excluding high income)Europe & Central Asia (IDA & IBRD countries)European UnionFijiFinlandFragile and conflict affected situationsFranceGabonGambia, TheGeorgiaGermanyGhanaGreeceGrenadaGuatemalaGuineaGuinea-BissauGuyanaHaitiHeavily indebted poor countries (HIPC)High incomeHondurasHong Kong SAR, ChinaHungaryIBRD onlyIcelandIDA & IBRD totalIDA blendIDA onlyIDA totalIndiaIndonesiaIran, Islamic Rep.IraqIrelandIsraelItalyJamaicaJapanJordanKazakhstanKenyaKiribatiKorea, Dem. People’s Rep.Korea, Rep.KuwaitKyrgyz RepublicLao PDRLate-demographic dividendLatin America & Caribbean Latin America & Caribbean (excluding high income)Latin America & the Caribbean (IDA & IBRD countries)LatviaLeast developed countries: UN classificationLebanonLesothoLiberiaLibyaLiechtensteinLithuaniaLow & middle incomeLow incomeLower middle incomeLuxembourgMacao SAR, ChinaMacedonia, FYRMadagascarMalawiMalaysiaMaldivesMaliMaltaMarshall IslandsMauritaniaMauritiusMexicoMicronesia, Fed. Sts.Middle East & North AfricaMiddle East & North Africa (excluding high income)Middle East & North Africa (IDA & IBRD countries)Middle incomeMoldovaMongoliaMontenegroMoroccoMozambiqueMyanmarNamibiaNauruNepalNetherlandsNew ZealandNicaraguaNigerNigeriaNorth AmericaNorwayOECD membersOmanOther small statesPacific island small statesPakistanPalauPanamaPapua New GuineaParaguayPeruPhilippinesPolandPortugalPost-demographic dividendPre-demographic dividendPuerto RicoQatarRomaniaRussian FederationRwandaSamoaSan MarinoSao Tome and PrincipeSaudi ArabiaSenegalSerbiaSeychellesSierra LeoneSloveniaSmall statesSolomon IslandsSomaliaSouth AfricaSouth AsiaSouth Asia (IDA & IBRD)South SudanSpainSri LankaSt. Kitts and NevisSt. LuciaSt. Vincent and the GrenadinesSub-Saharan Africa Sub-Saharan Africa (excluding high income)Sub-Saharan Africa (IDA & IBRD countries)SudanSurinameSwazilandSwedenSwitzerlandSyrian Arab RepublicTajikistanTanzaniaThailandTimor-LesteTogoTongaTrinidad and TobagoTunisiaTurkeyTuvaluUgandaUkraineUnited Arab EmiratesUnited KingdomUnited StatesUpper middle incomeUruguayUzbekistanVanuatuVenezuela, RBVietnamWest Bank and GazaWorldYemen, Rep.ZambiaZimbabwe Zeitlinie:
Diese Zeitleiste vorliegt die Graphik ab 1971 J. bis 2015 J. Least developed countries: UN classification. Die Angaben bis 1970 J. sind nicht vorhanden. Die Zahl aktueller Beobachtungen nach Daten: 45.
Die Quelle (Bezeichnung):
Kennzahlen der Weltentwicklung
Die Quelle (Einrichtung):
UNESCO Institute for Statistics
Kategorien:
Education
Es wurde aktualisiert:
23 Apr 2017 Jahr
Kennzahlen der Wertänderungen vom Jahr zum Jahr
im Durchschnitt:
32.875 Mln.
Minimum:
24.419 Mln.
1 Jan 2014 Jahr
Maximum:
42.116 Mln.
1 Jan 2000 Jahr
Zum Datum der Beobachtung
Wert
Absolute Veränderung
Die Veränderung bezüglich dem vorherigen Wert
1 Jan 1971 Jahr
30.993 Mln.
+30.993 Mln.
0.0%
1 Jan 1972 Jahr
31.905 Mln.
+911.848 Tsnd.
2.94%
1 Jan 1973 Jahr
30.744 Mln.
-1.161 Mln.
-3.64%
1 Jan 1974 Jahr
29.805 Mln.
-939.542 Tsnd.
-3.06%
1 Jan 1975 Jahr
30.502 Mln.
+697.35 Tsnd.
2.34%
1 Jan 1976 Jahr
29.645 Mln.
-856.83 Tsnd.
-2.81%
1 Jan 1977 Jahr
29.068 Mln.
-577.608 Tsnd.
-1.95%
1 Jan 1978 Jahr
29.026 Mln.
-41.702 Tsnd.
-0.14%
1 Jan 1979 Jahr
28.953 Mln.
-72.598 Tsnd.
-0.25%
1 Jan 1980 Jahr
29.09 Mln.
+136.088 Tsnd.
0.47%
1 Jan 1981 Jahr
28.891 Mln.
-198.56 Tsnd.
-0.68%
1 Jan 1982 Jahr
29.687 Mln.
+795.99 Tsnd.
2.76%
1 Jan 1983 Jahr
30.747 Mln.
+1.06 Mln.
3.57%
1 Jan 1984 Jahr
31.302 Mln.
+554.756 Tsnd.
1.8%
1 Jan 1985 Jahr
32.396 Mln.
+1.095 Mln.
3.5%
1 Jan 1986 Jahr
33.734 Mln.
+1.337 Mln.
4.13%
1 Jan 1987 Jahr
34.562 Mln.
+827.988 Tsnd.
2.45%
1 Jan 1988 Jahr
36.032 Mln.
+1.47 Mln.
4.25%
1 Jan 1989 Jahr
35.475 Mln.
-556.872 Tsnd.
-1.55%
1 Jan 1990 Jahr
36.734 Mln.
+1.259 Mln.
3.55%
1 Jan 1991 Jahr
38.164 Mln.
+1.43 Mln.
3.89%
1 Jan 1992 Jahr
38.064 Mln.
-99.8 Tsnd.
-0.26%
1 Jan 1993 Jahr
39.108 Mln.
+1.044 Mln.
2.74%
1 Jan 1994 Jahr
40.108 Mln.
+999.7 Tsnd.
2.56%
1 Jan 1995 Jahr
40.397 Mln.
+288.72 Tsnd.
0.72%
1 Jan 1996 Jahr
40.082 Mln.
-314.412 Tsnd.
-0.78%
1 Jan 1997 Jahr
40.804 Mln.
+721.456 Tsnd.
1.8%
1 Jan 1998 Jahr
40.253 Mln.
-551.036 Tsnd.
-1.35%
1 Jan 1999 Jahr
41.113 Mln.
+860.236 Tsnd.
2.14%
1 Jan 2000 Jahr
42.116 Mln.
+1.003 Mln.
2.44%
1 Jan 2001 Jahr
40.713 Mln.
-1.403 Mln.
-3.33%
1 Jan 2002 Jahr
39.236 Mln.
-1.476 Mln.
-3.63%
1 Jan 2003 Jahr
36.727 Mln.
-2.51 Mln.
-6.4%
1 Jan 2004 Jahr
34.381 Mln.
-2.346 Mln.
-6.39%
1 Jan 2005 Jahr
32.494 Mln.
-1.887 Mln.
-5.49%
1 Jan 2006 Jahr
30.444 Mln.
-2.05 Mln.
-6.31%
1 Jan 2007 Jahr
28.599 Mln.
-1.845 Mln.
-6.06%
1 Jan 2008 Jahr
28.055 Mln.
-543.996 Tsnd.
-1.9%
1 Jan 2009 Jahr
26.166 Mln.
-1.889 Mln.
-6.73%
1 Jan 2010 Jahr
26.335 Mln.
+169.328 Tsnd.
0.65%
1 Jan 2011 Jahr
27.095 Mln.
+759.164 Tsnd.
2.88%
1 Jan 2012 Jahr
25.666 Mln.
-1.428 Mln.
-5.27%
1 Jan 2013 Jahr
25.021 Mln.
-645.084 Tsnd.
-2.51%
1 Jan 2014 Jahr
24.419 Mln.
-601.984 Tsnd.
-2.41%
1 Jan 2015 Jahr
24.512 Mln.
+92.96 Tsnd.
0.38%
Bewertung der Länder gemäß mit laufender Statistik nach Jahren


Kommentare: