29
/de/
de
AIzaSyAYiBZKx7MnpbEhh9jyipgxe19OcubqV5w
April 1, 2024
44487
Least developed countries: UN classification
LDC
false
2
1
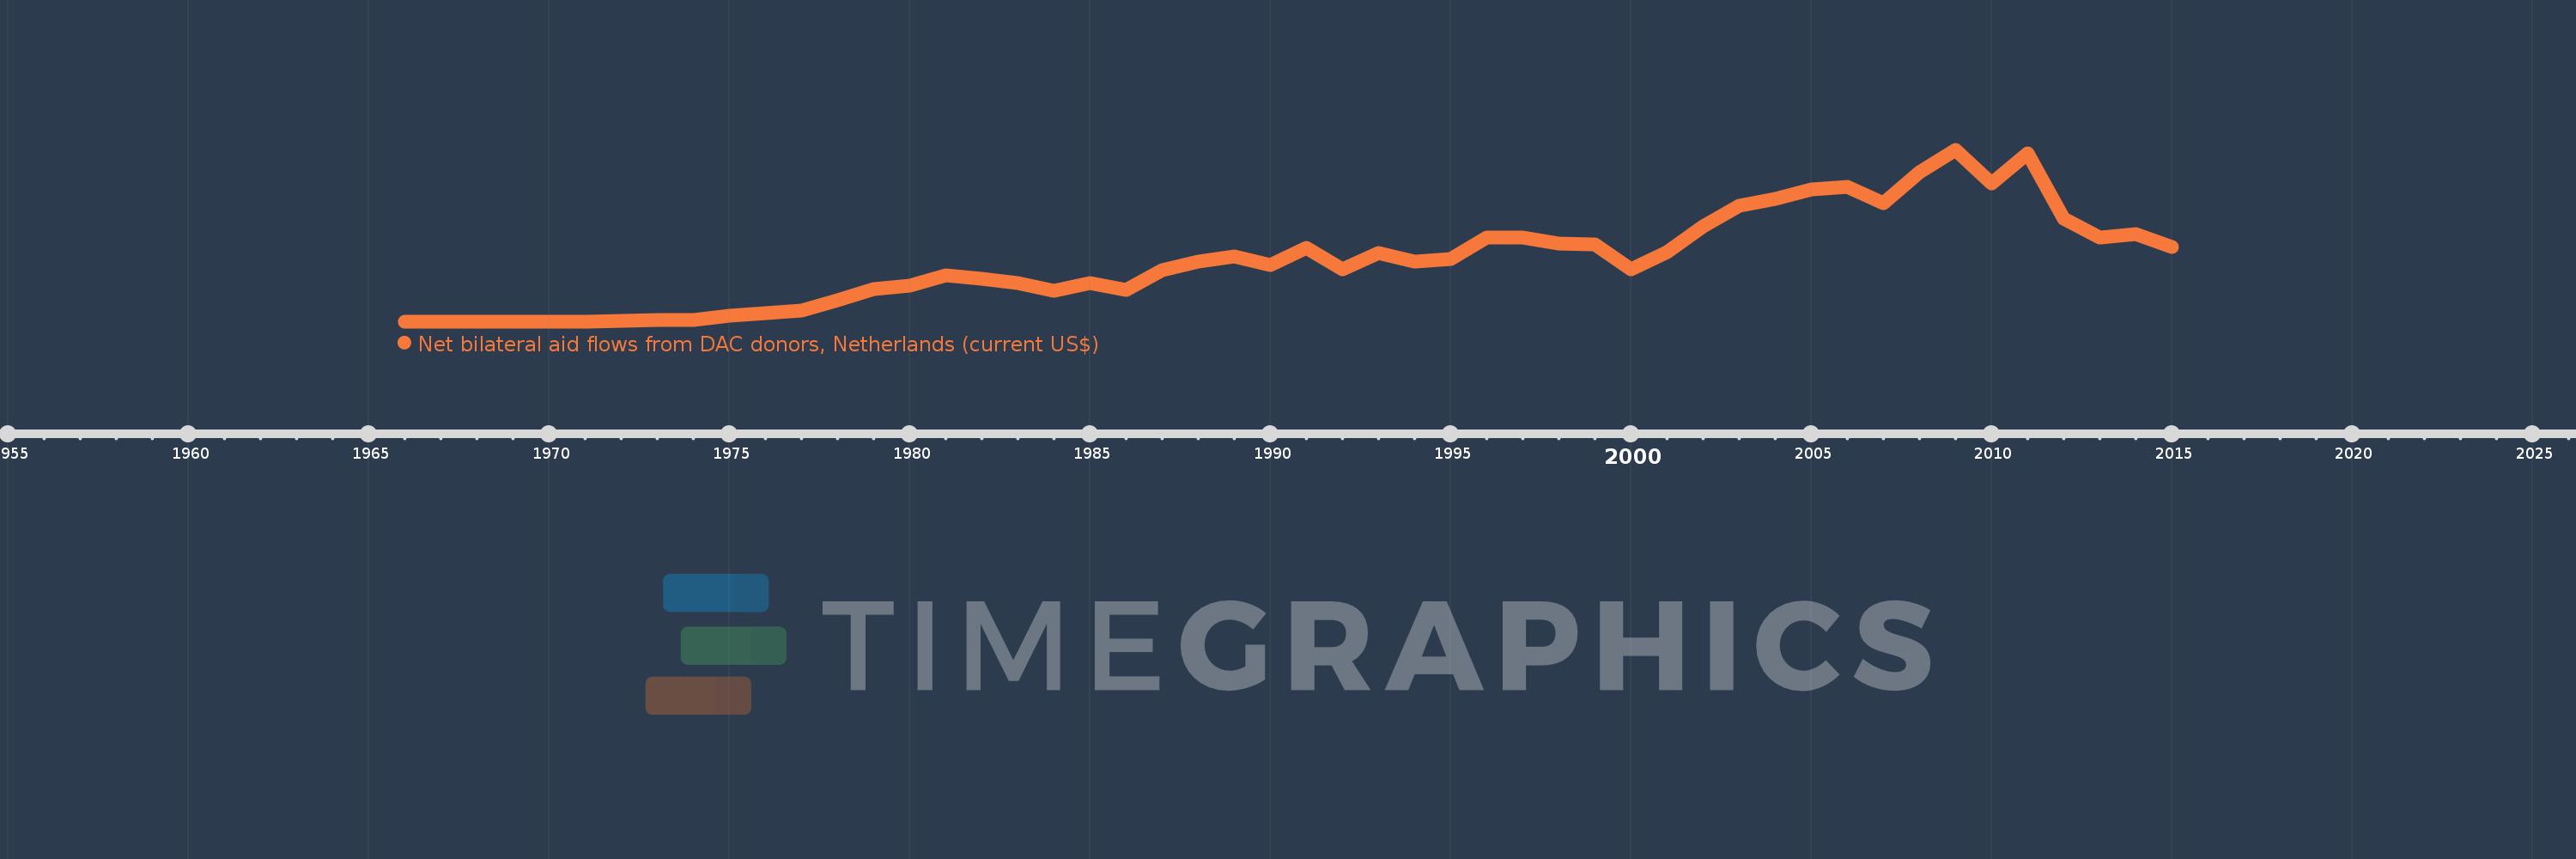
Net bilateral aid flows from DAC donors, Netherlands (current US$)
2015,2014,2013,2012,2011,2010,2009,2008,2007,2006,2005,2004,2003,2002,2001,2000,1999,1998,1997,1996,1995,1994,1993,1992,1991,1990,1989,1988,1987,1986,1985,1984,1983,1982,1981,1980,1979,1978,1977,1976,1975,1974,1973,1972,1971,1970,1969,1968,1966
Diese Statistik in anderen Ländern:
AfghanistanAlbaniaAlgeriaAngolaAntigua and BarbudaArab WorldArgentinaArmeniaArubaAzerbaijanBahamas, TheBahrainBangladeshBarbadosBelarusBelizeBeninBhutanBoliviaBosnia and HerzegovinaBotswanaBrazilBritish Virgin IslandsBrunei DarussalamBulgariaBurkina FasoBurundiCabo VerdeCambodiaCameroonCaribbean small statesCentral African RepublicCentral Europe and the BalticsChadChileChinaColombiaComorosCongo, Dem. Rep.Congo, Rep.Costa RicaCote d'IvoireCroatiaCubaCyprusCzech RepublicDjiboutiDominicaDominican RepublicEast Asia & PacificEast Asia & Pacific (excluding high income)East Asia & Pacific (IDA & IBRD countries)EcuadorEgypt, Arab Rep.El SalvadorEquatorial GuineaEritreaEstoniaEthiopiaEuro areaEurope & Central AsiaEurope & Central Asia (excluding high income)Europe & Central Asia (IDA & IBRD countries)European UnionFijiFragile and conflict affected situationsGabonGambia, TheGeorgiaGhanaGrenadaGuatemalaGuineaGuinea-BissauGuyanaHaitiHeavily indebted poor countries (HIPC)High incomeHondurasHong Kong SAR, ChinaHungaryIBRD onlyIDA & IBRD totalIDA blendIDA onlyIDA totalIndiaIndonesiaIran, Islamic Rep.IraqIsraelJamaicaJordanKazakhstanKenyaKiribatiKorea, Dem. People’s Rep.Korea, Rep.KosovoKuwaitKyrgyz RepublicLao PDRLatin America & Caribbean Latin America & Caribbean (excluding high income)Latin America & the Caribbean (IDA & IBRD countries)LatviaLeast developed countries: UN classificationLebanonLesothoLiberiaLibyaLithuaniaLow & middle incomeLow incomeLower middle incomeMacao SAR, ChinaMacedonia, FYRMadagascarMalawiMalaysiaMaldivesMaliMaltaMauritaniaMauritiusMexicoMicronesia, Fed. Sts.Middle East & North AfricaMiddle East & North Africa (excluding high income)Middle East & North Africa (IDA & IBRD countries)Middle incomeMoldovaMongoliaMontenegroMoroccoMozambiqueMyanmarNamibiaNepalNicaraguaNigerNigeriaNorthern Mariana IslandsOECD membersOmanOther small statesPacific island small statesPakistanPanamaPapua New GuineaParaguayPeruPhilippinesPolandRomaniaRussian FederationRwandaSamoaSao Tome and PrincipeSaudi ArabiaSenegalSerbiaSeychellesSierra LeoneSingaporeSlovak RepublicSloveniaSmall statesSolomon IslandsSomaliaSouth AfricaSouth AsiaSouth Asia (IDA & IBRD)South SudanSri LankaSt. Kitts and NevisSt. LuciaSt. Vincent and the GrenadinesSub-Saharan Africa Sub-Saharan Africa (excluding high income)Sub-Saharan Africa (IDA & IBRD countries)SudanSurinameSwazilandSyrian Arab RepublicTajikistanTanzaniaThailandTimor-LesteTogoTongaTrinidad and TobagoTunisiaTurkeyTurkmenistanTuvaluUgandaUkraineUnited Arab EmiratesUpper middle incomeUruguayUzbekistanVanuatuVenezuela, RBVietnamWest Bank and GazaWorldYemen, Rep.ZambiaZimbabwe Zeitlinie:
Diese Zeitleiste vorliegt die Graphik ab 1966 J. bis 2015 J. Least developed countries: UN classification. Die Angaben bis 1965 J. sind nicht vorhanden. Die Zahl aktueller Beobachtungen nach Daten: 49.
Die Quelle (Bezeichnung):
Kennzahlen der Weltentwicklung
Die Quelle (Einrichtung):
Development Assistance Committee of the Organisation for Economic Co-operation and Development, Geographical Distribution of Financial Flows to Developing Countries, Development Co-operation Report, and International Development Statistics database. Data are available online at: www.oecd.org/dac/stats/idsonline.
Kategorien:
Aid Effectiveness
Es wurde aktualisiert:
23 Apr 2017 Jahr
Kennzahlen der Wertänderungen vom Jahr zum Jahr
im Durchschnitt:
492.018 Mln.
Minimum:
100.0 Tsnd.
1 Jan 1969 Jahr
Maximum:
1.355 Mlrd.
1 Jan 2009 Jahr
Zum Datum der Beobachtung
Wert
Absolute Veränderung
Die Veränderung bezüglich dem vorherigen Wert
1 Jan 1966 Jahr
330.0 Tsnd.
+330.0 Tsnd.
0.0%
1 Jan 1968 Jahr
1.58 Mln.
+1.25 Mln.
378.79%
1 Jan 1969 Jahr
100.0 Tsnd.
-1.48 Mln.
-93.67%
1 Jan 1970 Jahr
120.0 Tsnd.
+20.0 Tsnd.
20.0%
1 Jan 1971 Jahr
4.86 Mln.
+4.74 Mln.
3.95 Tsnd.%
1 Jan 1972 Jahr
7.96 Mln.
+3.1 Mln.
63.79%
1 Jan 1973 Jahr
14.51 Mln.
+6.55 Mln.
82.29%
1 Jan 1974 Jahr
17.42 Mln.
+2.91 Mln.
20.06%
1 Jan 1975 Jahr
48.27 Mln.
+30.85 Mln.
177.1%
1 Jan 1976 Jahr
66.99 Mln.
+18.72 Mln.
38.78%
1 Jan 1977 Jahr
88.84 Mln.
+21.85 Mln.
32.62%
1 Jan 1978 Jahr
170.91 Mln.
+82.07 Mln.
92.38%
1 Jan 1979 Jahr
257.92 Mln.
+87.01 Mln.
50.91%
1 Jan 1980 Jahr
288.59 Mln.
+30.67 Mln.
11.89%
1 Jan 1981 Jahr
368.36 Mln.
+79.77 Mln.
27.64%
1 Jan 1982 Jahr
337.85 Mln.
-30.51 Mln.
-8.28%
1 Jan 1983 Jahr
309.52 Mln.
-28.33 Mln.
-8.39%
1 Jan 1984 Jahr
245.5 Mln.
-64.02 Mln.
-20.68%
1 Jan 1985 Jahr
304.39 Mln.
+58.89 Mln.
23.99%
1 Jan 1986 Jahr
251.91 Mln.
-52.48 Mln.
-17.24%
1 Jan 1987 Jahr
409.02 Mln.
+157.11 Mln.
62.37%
1 Jan 1988 Jahr
475.44 Mln.
+66.42 Mln.
16.24%
1 Jan 1989 Jahr
520.02 Mln.
+44.58 Mln.
9.38%
1 Jan 1990 Jahr
451.26 Mln.
-68.76 Mln.
-13.22%
1 Jan 1991 Jahr
582.77 Mln.
+131.51 Mln.
29.14%
1 Jan 1992 Jahr
412.29 Mln.
-170.48 Mln.
-29.25%
1 Jan 1993 Jahr
546.58 Mln.
+134.29 Mln.
32.57%
1 Jan 1994 Jahr
477.91 Mln.
-68.67 Mln.
-12.56%
1 Jan 1995 Jahr
493.97 Mln.
+16.06 Mln.
3.36%
1 Jan 1996 Jahr
662.88 Mln.
+168.91 Mln.
34.19%
1 Jan 1997 Jahr
663.62 Mln.
+740.0 Tsnd.
0.11%
1 Jan 1998 Jahr
617.9 Mln.
-45.72 Mln.
-6.89%
1 Jan 1999 Jahr
612.67 Mln.
-5.23 Mln.
-0.85%
1 Jan 2000 Jahr
418.06 Mln.
-194.61 Mln.
-31.76%
1 Jan 2001 Jahr
553.13 Mln.
+135.07 Mln.
32.31%
1 Jan 2002 Jahr
757.17 Mln.
+204.04 Mln.
36.89%
1 Jan 2003 Jahr
918.24 Mln.
+161.07 Mln.
21.27%
1 Jan 2004 Jahr
972.63 Mln.
+54.39 Mln.
5.92%
1 Jan 2005 Jahr
1.045 Mlrd.
+72.75 Mln.
7.48%
1 Jan 2006 Jahr
1.065 Mlrd.
+19.83 Mln.
1.9%
1 Jan 2007 Jahr
939.54 Mln.
-125.67 Mln.
-11.8%
1 Jan 2008 Jahr
1.181 Mlrd.
+241.16 Mln.
25.67%
1 Jan 2009 Jahr
1.355 Mlrd.
+174.44 Mln.
14.77%
1 Jan 2010 Jahr
1.095 Mlrd.
-260.58 Mln.
-19.23%
1 Jan 2011 Jahr
1.332 Mlrd.
+237.14 Mln.
21.67%
1 Jan 2012 Jahr
816.44 Mln.
-515.26 Mln.
-38.69%
1 Jan 2013 Jahr
665.01 Mln.
-151.43 Mln.
-18.55%
1 Jan 2014 Jahr
693.82 Mln.
+28.81 Mln.
4.33%
1 Jan 2015 Jahr
589.87 Mln.
-103.95 Mln.
-14.98%
Bewertung der Länder gemäß mit laufender Statistik nach Jahren


Kommentare: