29
/de/
de
AIzaSyAYiBZKx7MnpbEhh9jyipgxe19OcubqV5w
April 1, 2024
43418
Latin America & the Caribbean (IDA & IBRD countries)
TLA
false
2
1
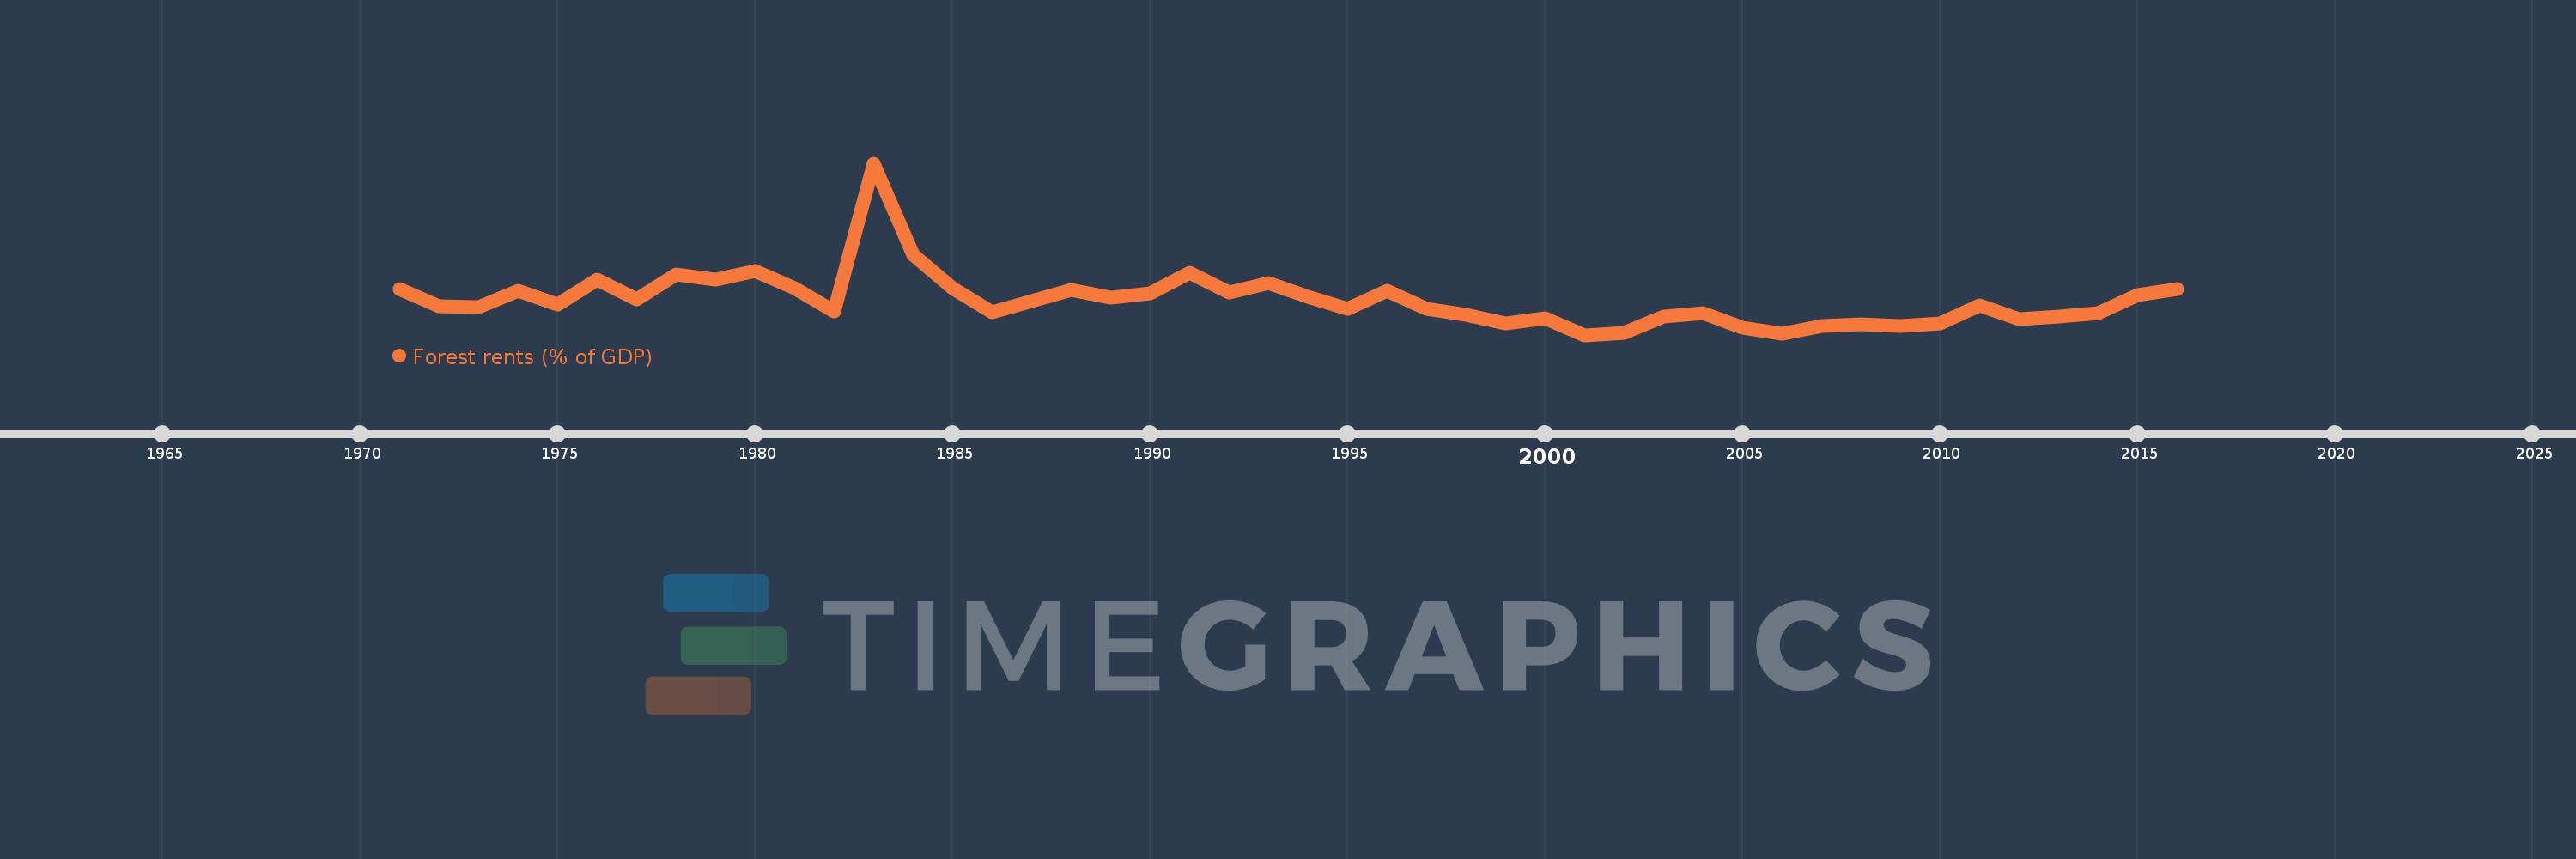
Forest rents (% of GDP)
2016,2015,2014,2013,2012,2011,2010,2009,2008,2007,2006,2005,2004,2003,2002,2001,2000,1999,1998,1997,1996,1995,1994,1993,1992,1991,1990,1989,1988,1987,1986,1985,1984,1983,1982,1981,1980,1979,1978,1977,1976,1975,1974,1973,1972,1971
Diese Statistik in anderen Ländern:
AfghanistanAlbaniaAlgeriaAndorraAngolaArab WorldArgentinaArmeniaArubaAustraliaAustriaAzerbaijanBahamas, TheBahrainBangladeshBarbadosBelarusBelgiumBelizeBeninBhutanBoliviaBosnia and HerzegovinaBotswanaBrazilBrunei DarussalamBulgariaBurkina FasoBurundiCabo VerdeCambodiaCameroonCanadaCaribbean small statesCentral African RepublicCentral Europe and the BalticsChadChileChinaColombiaComorosCongo, Dem. Rep.Congo, Rep.Costa RicaCote d'IvoireCroatiaCubaCyprusCzech RepublicDenmarkDjiboutiDominicaDominican RepublicEarly-demographic dividendEast Asia & PacificEast Asia & Pacific (excluding high income)East Asia & Pacific (IDA & IBRD countries)EcuadorEgypt, Arab Rep.El SalvadorEquatorial GuineaEritreaEstoniaEthiopiaEuro areaEurope & Central AsiaEurope & Central Asia (excluding high income)Europe & Central Asia (IDA & IBRD countries)European UnionFaroe IslandsFijiFinlandFragile and conflict affected situationsFranceFrench PolynesiaGabonGambia, TheGeorgiaGermanyGhanaGreeceGuatemalaGuineaGuinea-BissauGuyanaHaitiHeavily indebted poor countries (HIPC)High incomeHondurasHong Kong SAR, ChinaHungaryIBRD onlyIcelandIDA & IBRD totalIDA blendIDA onlyIDA totalIndiaIndonesiaIran, Islamic Rep.IraqIrelandIsraelItalyJamaicaJapanJordanKazakhstanKenyaKiribatiKorea, Rep.KuwaitKyrgyz RepublicLao PDRLate-demographic dividendLatin America & Caribbean Latin America & Caribbean (excluding high income)Latin America & the Caribbean (IDA & IBRD countries)LatviaLeast developed countries: UN classificationLebanonLesothoLiberiaLibyaLiechtensteinLithuaniaLow & middle incomeLow incomeLower middle incomeLuxembourgMacao SAR, ChinaMacedonia, FYRMadagascarMalawiMalaysiaMaldivesMaliMaltaMauritaniaMauritiusMexicoMicronesia, Fed. Sts.Middle East & North AfricaMiddle East & North Africa (excluding high income)Middle East & North Africa (IDA & IBRD countries)Middle incomeMoldovaMongoliaMontenegroMoroccoMozambiqueMyanmarNamibiaNepalNetherlandsNew CaledoniaNew ZealandNicaraguaNigerNigeriaNorth AmericaNorwayOECD membersOmanOther small statesPacific island small statesPakistanPanamaPapua New GuineaParaguayPeruPhilippinesPolandPortugalPost-demographic dividendPre-demographic dividendQatarRomaniaRussian FederationRwandaSamoaSao Tome and PrincipeSaudi ArabiaSenegalSerbiaSeychellesSierra LeoneSingaporeSlovak RepublicSloveniaSmall statesSolomon IslandsSomaliaSouth AfricaSouth AsiaSouth Asia (IDA & IBRD)South SudanSpainSri LankaSt. LuciaSt. Vincent and the GrenadinesSub-Saharan Africa Sub-Saharan Africa (excluding high income)Sub-Saharan Africa (IDA & IBRD countries)SudanSurinameSwazilandSwedenSwitzerlandSyrian Arab RepublicTajikistanTanzaniaThailandTimor-LesteTogoTongaTrinidad and TobagoTunisiaTurkeyTurkmenistanUgandaUkraineUnited Arab EmiratesUnited KingdomUnited StatesUpper middle incomeUruguayUzbekistanVanuatuVenezuela, RBVietnamWorldYemen, Rep.ZambiaZimbabwe Zeitlinie:
Diese Zeitleiste vorliegt die Graphik ab 1971 J. bis 2016 J. Latin America & the Caribbean (IDA & IBRD countries). Die Angaben bis 1970 J. sind nicht vorhanden. Die Zahl aktueller Beobachtungen nach Daten: 46.
Die Quelle (Bezeichnung):
Kennzahlen der Weltentwicklung
Die Quelle (Einrichtung):
Estimates based on sources and methods described in "The Changing Wealth of Nations: Measuring Sustainable Development in the New Millennium" (World Bank, 2011).
Kategorien:
Environment
Es wurde aktualisiert:
23 Apr 2017 Jahr
Kennzahlen der Wertänderungen vom Jahr zum Jahr
Minimum:
0.233
1 Jan 2001 Jahr
Maximum:
1.065
1 Jan 1983 Jahr
Zum Datum der Beobachtung
Wert
Absolute Veränderung
Die Veränderung bezüglich dem vorherigen Wert
1 Jan 1971 Jahr
0.457
+0.457
0.0%
1 Jan 1972 Jahr
0.373
-0.084
-18.35%
1 Jan 1973 Jahr
0.37
-0.003
-0.78%
1 Jan 1974 Jahr
0.449
+0.079
21.24%
1 Jan 1975 Jahr
0.382
-0.066
-14.79%
1 Jan 1976 Jahr
0.501
+0.118
30.97%
1 Jan 1977 Jahr
0.406
-0.094
-18.85%
1 Jan 1978 Jahr
0.526
+0.12
29.42%
1 Jan 1979 Jahr
0.502
-0.024
-4.55%
1 Jan 1980 Jahr
0.541
+0.039
7.72%
1 Jan 1981 Jahr
0.459
-0.082
-15.15%
1 Jan 1982 Jahr
0.349
-0.11
-23.88%
1 Jan 1983 Jahr
1.065
+0.716
204.91%
1 Jan 1984 Jahr
0.623
-0.442
-41.51%
1 Jan 1985 Jahr
0.458
-0.165
-26.53%
1 Jan 1986 Jahr
0.343
-0.115
-25.06%
1 Jan 1987 Jahr
0.399
+0.056
16.18%
1 Jan 1988 Jahr
0.453
+0.055
13.71%
1 Jan 1989 Jahr
0.413
-0.04
-8.77%
1 Jan 1990 Jahr
0.436
+0.023
5.49%
1 Jan 1991 Jahr
0.536
+0.1
22.86%
1 Jan 1992 Jahr
0.441
-0.095
-17.73%
1 Jan 1993 Jahr
0.484
+0.043
9.77%
1 Jan 1994 Jahr
0.419
-0.064
-13.31%
1 Jan 1995 Jahr
0.359
-0.061
-14.43%
1 Jan 1996 Jahr
0.446
+0.087
24.37%
1 Jan 1997 Jahr
0.358
-0.088
-19.72%
1 Jan 1998 Jahr
0.329
-0.029
-8.11%
1 Jan 1999 Jahr
0.29
-0.04
-12.01%
1 Jan 2000 Jahr
0.315
+0.025
8.67%
1 Jan 2001 Jahr
0.233
-0.082
-25.93%
1 Jan 2002 Jahr
0.243
+0.01
4.31%
1 Jan 2003 Jahr
0.323
+0.079
32.63%
1 Jan 2004 Jahr
0.341
+0.018
5.68%
1 Jan 2005 Jahr
0.269
-0.072
-21.23%
1 Jan 2006 Jahr
0.239
-0.03
-11.12%
1 Jan 2007 Jahr
0.276
+0.037
15.54%
1 Jan 2008 Jahr
0.284
+0.008
2.78%
1 Jan 2009 Jahr
0.276
-0.008
-2.79%
1 Jan 2010 Jahr
0.29
+0.014
5.21%
1 Jan 2011 Jahr
0.376
+0.086
29.78%
1 Jan 2012 Jahr
0.311
-0.066
-17.49%
1 Jan 2013 Jahr
0.324
+0.013
4.29%
1 Jan 2014 Jahr
0.341
+0.017
5.31%
1 Jan 2015 Jahr
0.425
+0.084
24.63%
1 Jan 2016 Jahr
0.454
+0.029
6.85%
Bewertung der Länder gemäß mit laufender Statistik nach Jahren


Kommentare: