29
/de/
de
AIzaSyAYiBZKx7MnpbEhh9jyipgxe19OcubqV5w
April 1, 2024
43412
Latin America & the Caribbean (IDA & IBRD countries)
TLA
false
2
1
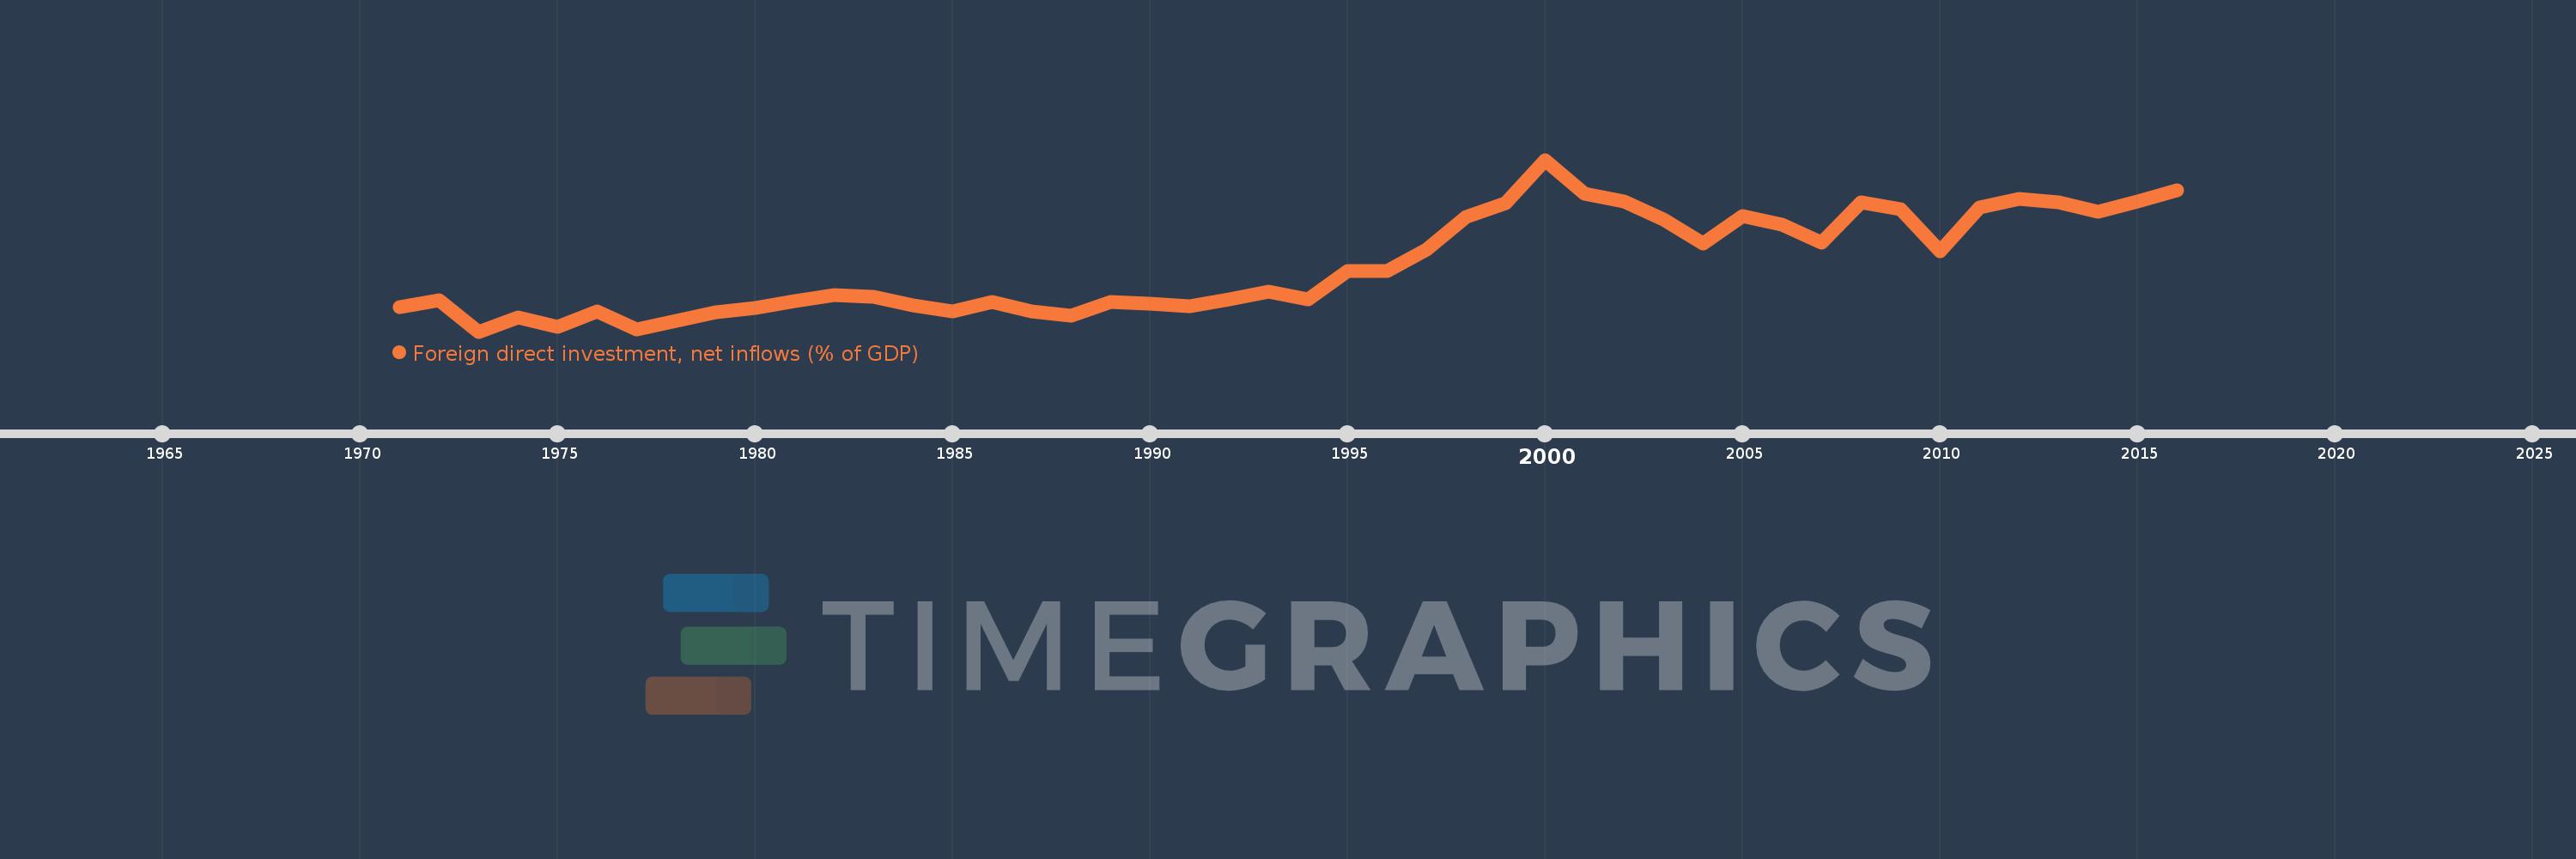
Foreign direct investment, net inflows (% of GDP)
2016,2015,2014,2013,2012,2011,2010,2009,2008,2007,2006,2005,2004,2003,2002,2001,2000,1999,1998,1997,1996,1995,1994,1993,1992,1991,1990,1989,1988,1987,1986,1985,1984,1983,1982,1981,1980,1979,1978,1977,1976,1975,1974,1973,1972,1971
Diese Statistik in anderen Ländern:
AfghanistanAlbaniaAlgeriaAngolaAntigua and BarbudaArab WorldArgentinaArmeniaArubaAustraliaAustriaAzerbaijanBahamas, TheBahrainBangladeshBarbadosBelarusBelgiumBelizeBeninBermudaBhutanBoliviaBosnia and HerzegovinaBotswanaBrazilBrunei DarussalamBulgariaBurkina FasoBurundiCabo VerdeCambodiaCameroonCanadaCaribbean small statesCayman IslandsCentral African RepublicCentral Europe and the BalticsChadChileChinaColombiaComorosCongo, Dem. Rep.Congo, Rep.Costa RicaCote d'IvoireCroatiaCyprusCzech RepublicDenmarkDjiboutiDominicaDominican RepublicEarly-demographic dividendEast Asia & PacificEast Asia & Pacific (excluding high income)East Asia & Pacific (IDA & IBRD countries)EcuadorEgypt, Arab Rep.El SalvadorEquatorial GuineaEritreaEstoniaEthiopiaEuro areaEurope & Central AsiaEurope & Central Asia (excluding high income)Europe & Central Asia (IDA & IBRD countries)European UnionFijiFinlandFragile and conflict affected situationsFranceFrench PolynesiaGabonGambia, TheGeorgiaGermanyGhanaGreeceGrenadaGuatemalaGuineaGuinea-BissauGuyanaHaitiHeavily indebted poor countries (HIPC)High incomeHondurasHong Kong SAR, ChinaHungaryIBRD onlyIcelandIDA & IBRD totalIDA blendIDA onlyIDA totalIndiaIndonesiaIran, Islamic Rep.IraqIrelandIsraelItalyJamaicaJapanJordanKazakhstanKenyaKiribatiKorea, Rep.KosovoKuwaitKyrgyz RepublicLao PDRLate-demographic dividendLatin America & Caribbean Latin America & Caribbean (excluding high income)Latin America & the Caribbean (IDA & IBRD countries)LatviaLeast developed countries: UN classificationLebanonLesothoLiberiaLibyaLithuaniaLow & middle incomeLow incomeLower middle incomeLuxembourgMacao SAR, ChinaMacedonia, FYRMadagascarMalawiMalaysiaMaldivesMaliMaltaMarshall IslandsMauritaniaMauritiusMexicoMicronesia, Fed. Sts.Middle East & North AfricaMiddle East & North Africa (excluding high income)Middle East & North Africa (IDA & IBRD countries)Middle incomeMoldovaMongoliaMontenegroMoroccoMozambiqueMyanmarNamibiaNauruNepalNetherlandsNew CaledoniaNew ZealandNicaraguaNigerNigeriaNorth AmericaNorwayOECD membersOmanOther small statesPacific island small statesPakistanPalauPanamaPapua New GuineaParaguayPeruPhilippinesPolandPortugalPost-demographic dividendPre-demographic dividendQatarRomaniaRussian FederationRwandaSamoaSao Tome and PrincipeSaudi ArabiaSenegalSerbiaSeychellesSierra LeoneSingaporeSlovak RepublicSloveniaSmall statesSolomon IslandsSomaliaSouth AfricaSouth AsiaSouth Asia (IDA & IBRD)South SudanSpainSri LankaSt. Kitts and NevisSt. LuciaSt. Vincent and the GrenadinesSub-Saharan Africa Sub-Saharan Africa (excluding high income)Sub-Saharan Africa (IDA & IBRD countries)SudanSurinameSwazilandSwedenSwitzerlandSyrian Arab RepublicTajikistanTanzaniaThailandTimor-LesteTogoTongaTrinidad and TobagoTunisiaTurkeyTurkmenistanTuvaluUgandaUkraineUnited Arab EmiratesUnited KingdomUnited StatesUpper middle incomeUruguayUzbekistanVanuatuVenezuela, RBVietnamWest Bank and GazaWorldYemen, Rep.ZambiaZimbabwe Zeitlinie:
Diese Zeitleiste vorliegt die Graphik ab 1971 J. bis 2016 J. Latin America & the Caribbean (IDA & IBRD countries). Die Angaben bis 1970 J. sind nicht vorhanden. Die Zahl aktueller Beobachtungen nach Daten: 46.
Die Quelle (Bezeichnung):
Kennzahlen der Weltentwicklung
Die Quelle (Einrichtung):
International Monetary Fund, International Financial Statistics and Balance of Payments databases, World Bank, International Debt Statistics, and World Bank and OECD GDP estimates.
Kategorien:
Economy & Growth, Financial Sector, Climate Change
Es wurde aktualisiert:
23 Apr 2017 Jahr
Kennzahlen der Wertänderungen vom Jahr zum Jahr
Minimum:
0.099
1 Jan 1973 Jahr
Maximum:
4.565
1 Jan 2000 Jahr
Zum Datum der Beobachtung
Wert
Absolute Veränderung
Die Veränderung bezüglich dem vorherigen Wert
1 Jan 1971 Jahr
0.732
+0.732
0.0%
1 Jan 1972 Jahr
0.911
+0.179
24.52%
1 Jan 1973 Jahr
0.099
-0.812
-89.14%
1 Jan 1974 Jahr
0.477
+0.378
381.72%
1 Jan 1975 Jahr
0.222
-0.254
-53.36%
1 Jan 1976 Jahr
0.625
+0.403
181.13%
1 Jan 1977 Jahr
0.162
-0.463
-74.15%
1 Jan 1978 Jahr
0.38
+0.219
135.35%
1 Jan 1979 Jahr
0.596
+0.216
56.83%
1 Jan 1980 Jahr
0.716
+0.12
20.15%
1 Jan 1981 Jahr
0.902
+0.186
25.92%
1 Jan 1982 Jahr
1.046
+0.144
15.97%
1 Jan 1983 Jahr
1.009
-0.038
-3.6%
1 Jan 1984 Jahr
0.773
-0.236
-23.39%
1 Jan 1985 Jahr
0.628
-0.145
-18.72%
1 Jan 1986 Jahr
0.862
+0.234
37.27%
1 Jan 1987 Jahr
0.615
-0.247
-28.68%
1 Jan 1988 Jahr
0.501
-0.114
-18.52%
1 Jan 1989 Jahr
0.874
+0.373
74.45%
1 Jan 1990 Jahr
0.825
-0.048
-5.55%
1 Jan 1991 Jahr
0.749
-0.077
-9.32%
1 Jan 1992 Jahr
0.946
+0.197
26.35%
1 Jan 1993 Jahr
1.147
+0.201
21.23%
1 Jan 1994 Jahr
0.926
-0.22
-19.21%
1 Jan 1995 Jahr
1.678
+0.752
81.17%
1 Jan 1996 Jahr
1.67
-0.008
-0.48%
1 Jan 1997 Jahr
2.239
+0.569
34.08%
1 Jan 1998 Jahr
3.086
+0.847
37.8%
1 Jan 1999 Jahr
3.429
+0.342
11.1%
1 Jan 2000 Jahr
4.565
+1.136
33.14%
1 Jan 2001 Jahr
3.681
-0.884
-19.37%
1 Jan 2002 Jahr
3.477
-0.204
-5.54%
1 Jan 2003 Jahr
3.004
-0.473
-13.6%
1 Jan 2004 Jahr
2.377
-0.627
-20.86%
1 Jan 2005 Jahr
3.097
+0.72
30.28%
1 Jan 2006 Jahr
2.869
-0.229
-7.38%
1 Jan 2007 Jahr
2.418
-0.451
-15.72%
1 Jan 2008 Jahr
3.449
+1.032
42.67%
1 Jan 2009 Jahr
3.285
-0.164
-4.76%
1 Jan 2010 Jahr
2.186
-1.099
-33.45%
1 Jan 2011 Jahr
3.328
+1.142
52.22%
1 Jan 2012 Jahr
3.544
+0.216
6.49%
1 Jan 2013 Jahr
3.469
-0.075
-2.1%
1 Jan 2014 Jahr
3.219
-0.251
-7.22%
1 Jan 2015 Jahr
3.489
+0.27
8.4%
1 Jan 2016 Jahr
3.781
+0.292
8.38%
Bewertung der Länder gemäß mit laufender Statistik nach Jahren


Kommentare: