29
/de/
de
AIzaSyAYiBZKx7MnpbEhh9jyipgxe19OcubqV5w
April 1, 2024
41416
Latin America & Caribbean
LCN
false
2
1
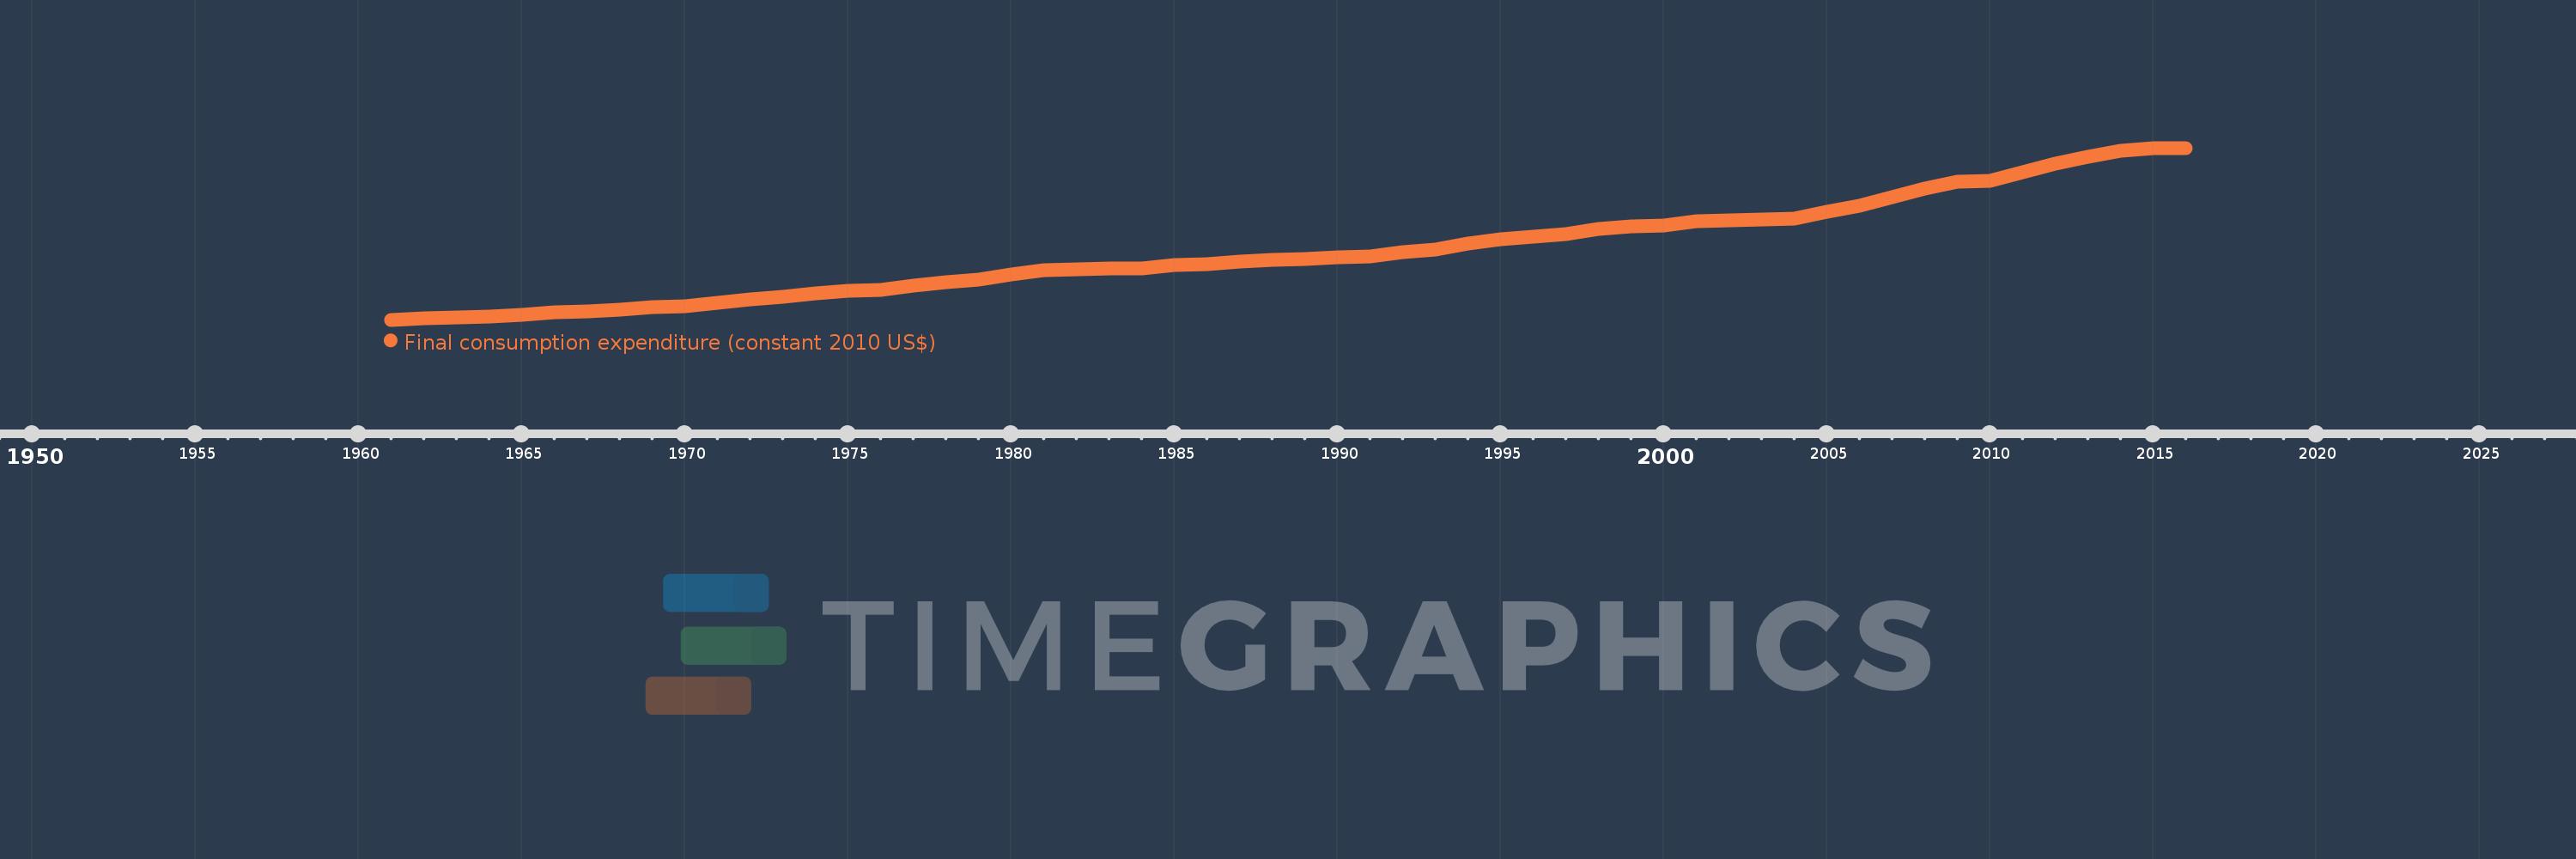
Final consumption expenditure (constant 2010 US$)
2016,2015,2014,2013,2012,2011,2010,2009,2008,2007,2006,2005,2004,2003,2002,2001,2000,1999,1998,1997,1996,1995,1994,1993,1992,1991,1990,1989,1988,1987,1986,1985,1984,1983,1982,1981,1980,1979,1978,1977,1976,1975,1974,1973,1972,1971,1970,1969,1968,1967,1966,1965,1964,1963,1962,1961
Diese Statistik in anderen Ländern:
AfghanistanAlbaniaAlgeriaAngolaAntigua and BarbudaArab WorldArgentinaArmeniaArubaAustraliaAustriaAzerbaijanBahamas, TheBahrainBangladeshBarbadosBelarusBelgiumBelizeBeninBermudaBhutanBoliviaBosnia and HerzegovinaBotswanaBrazilBrunei DarussalamBulgariaBurkina FasoBurundiCabo VerdeCambodiaCameroonCanadaCaribbean small statesCentral African RepublicCentral Europe and the BalticsChadChileChinaColombiaComorosCongo, Dem. Rep.Congo, Rep.Costa RicaCote d'IvoireCroatiaCubaCyprusCzech RepublicDenmarkDominicaDominican RepublicEarly-demographic dividendEast Asia & PacificEast Asia & Pacific (excluding high income)East Asia & Pacific (IDA & IBRD countries)EcuadorEgypt, Arab Rep.El SalvadorEquatorial GuineaEritreaEstoniaEuro areaEurope & Central AsiaEurope & Central Asia (excluding high income)Europe & Central Asia (IDA & IBRD countries)European UnionFaroe IslandsFinlandFranceGabonGambia, TheGeorgiaGermanyGhanaGreeceGrenadaGuatemalaGuineaGuinea-BissauGuyanaHaitiHeavily indebted poor countries (HIPC)High incomeHondurasHong Kong SAR, ChinaHungaryIBRD onlyIcelandIDA & IBRD totalIDA blendIDA onlyIDA totalIndiaIndonesiaIran, Islamic Rep.IrelandIsraelItalyJamaicaJapanJordanKazakhstanKenyaKorea, Rep.KosovoKuwaitKyrgyz RepublicLao PDRLate-demographic dividendLatin America & Caribbean Latin America & Caribbean (excluding high income)Latin America & the Caribbean (IDA & IBRD countries)LatviaLeast developed countries: UN classificationLebanonLiberiaLithuaniaLow & middle incomeLow incomeLower middle incomeLuxembourgMacao SAR, ChinaMacedonia, FYRMadagascarMalawiMalaysiaMaliMaltaMauritaniaMauritiusMexicoMiddle East & North AfricaMiddle East & North Africa (excluding high income)Middle East & North Africa (IDA & IBRD countries)Middle incomeMoldovaMongoliaMontenegroMoroccoMozambiqueNamibiaNepalNetherlandsNew ZealandNicaraguaNigerNigeriaNorth AmericaNorwayOECD membersOmanOther small statesPakistanPanamaParaguayPeruPhilippinesPolandPortugalPost-demographic dividendPre-demographic dividendPuerto RicoQatarRomaniaRussian FederationRwandaSaudi ArabiaSenegalSerbiaSeychellesSierra LeoneSingaporeSlovak RepublicSloveniaSmall statesSouth AfricaSouth AsiaSouth Asia (IDA & IBRD)South SudanSpainSri LankaSt. Kitts and NevisSt. LuciaSt. Vincent and the GrenadinesSub-Saharan Africa Sub-Saharan Africa (excluding high income)Sub-Saharan Africa (IDA & IBRD countries)SudanSurinameSwazilandSwedenSwitzerlandTajikistanTanzaniaThailandTimor-LesteTogoTongaTrinidad and TobagoTunisiaTurkeyUgandaUkraineUnited Arab EmiratesUnited KingdomUnited StatesUpper middle incomeUruguayUzbekistanVanuatuVenezuela, RBVietnamWest Bank and GazaWorldYemen, Rep.ZambiaZimbabwe Zeitlinie:
Diese Zeitleiste vorliegt die Graphik ab 1961 J. bis 2016 J. Latin America & Caribbean . Die Angaben bis 1960 J. sind nicht vorhanden. Die Zahl aktueller Beobachtungen nach Daten: 56.
Die Quelle (Bezeichnung):
Kennzahlen der Weltentwicklung
Die Quelle (Einrichtung):
World Bank national accounts data, and OECD National Accounts data files.
Kategorien:
Economy & Growth
Es wurde aktualisiert:
23 Apr 2017 Jahr
Kennzahlen der Wertänderungen vom Jahr zum Jahr
im Durchschnitt:
2.228 Trln
Minimum:
542.663 Mlrd.
1 Jan 1961 Jahr
Maximum:
4.744 Trln
1 Jan 2016 Jahr
Zum Datum der Beobachtung
Wert
Absolute Veränderung
Die Veränderung bezüglich dem vorherigen Wert
1 Jan 1961 Jahr
542.663 Mlrd.
+542.663 Mlrd.
0.0%
1 Jan 1962 Jahr
583.667 Mlrd.
+41.004 Mlrd.
7.56%
1 Jan 1963 Jahr
605.178 Mlrd.
+21.512 Mlrd.
3.69%
1 Jan 1964 Jahr
620.87 Mlrd.
+15.692 Mlrd.
2.59%
1 Jan 1965 Jahr
661.074 Mlrd.
+40.204 Mlrd.
6.48%
1 Jan 1966 Jahr
716.768 Mlrd.
+55.694 Mlrd.
8.42%
1 Jan 1967 Jahr
754.273 Mlrd.
+37.505 Mlrd.
5.23%
1 Jan 1968 Jahr
797.067 Mlrd.
+42.795 Mlrd.
5.67%
1 Jan 1969 Jahr
852.735 Mlrd.
+55.668 Mlrd.
6.98%
1 Jan 1970 Jahr
882.829 Mlrd.
+30.094 Mlrd.
3.53%
1 Jan 1971 Jahr
959.881 Mlrd.
+77.052 Mlrd.
8.73%
1 Jan 1972 Jahr
1.035 Trln
+75.598 Mlrd.
7.88%
1 Jan 1973 Jahr
1.109 Trln
+73.326 Mlrd.
7.08%
1 Jan 1974 Jahr
1.188 Trln
+79.179 Mlrd.
7.14%
1 Jan 1975 Jahr
1.256 Trln
+67.761 Mlrd.
5.7%
1 Jan 1976 Jahr
1.281 Trln
+25.375 Mlrd.
2.02%
1 Jan 1977 Jahr
1.384 Trln
+102.938 Mlrd.
8.03%
1 Jan 1978 Jahr
1.464 Trln
+80.384 Mlrd.
5.81%
1 Jan 1979 Jahr
1.518 Trln
+53.085 Mlrd.
3.62%
1 Jan 1980 Jahr
1.642 Trln
+124.413 Mlrd.
8.2%
1 Jan 1981 Jahr
1.758 Trln
+115.979 Mlrd.
7.06%
1 Jan 1982 Jahr
1.784 Trln
+26.119 Mlrd.
1.49%
1 Jan 1983 Jahr
1.799 Trln
+14.505 Mlrd.
0.81%
1 Jan 1984 Jahr
1.798 Trln
-130.78 Mln.
-0.01%
1 Jan 1985 Jahr
1.872 Trln
+74.086 Mlrd.
4.12%
1 Jan 1986 Jahr
1.904 Trln
+31.978 Mlrd.
1.71%
1 Jan 1987 Jahr
1.973 Trln
+68.335 Mlrd.
3.59%
1 Jan 1988 Jahr
2.014 Trln
+40.784 Mlrd.
2.07%
1 Jan 1989 Jahr
2.031 Trln
+17.249 Mlrd.
0.86%
1 Jan 1990 Jahr
2.062 Trln
+31.232 Mlrd.
1.54%
1 Jan 1991 Jahr
2.081 Trln
+19.227 Mlrd.
0.93%
1 Jan 1992 Jahr
2.194 Trln
+112.909 Mlrd.
5.42%
1 Jan 1993 Jahr
2.264 Trln
+70.23 Mlrd.
3.2%
1 Jan 1994 Jahr
2.411 Trln
+146.905 Mlrd.
6.49%
1 Jan 1995 Jahr
2.52 Trln
+108.176 Mlrd.
4.49%
1 Jan 1996 Jahr
2.57 Trln
+50.918 Mlrd.
2.02%
1 Jan 1997 Jahr
2.641 Trln
+70.454 Mlrd.
2.74%
1 Jan 1998 Jahr
2.763 Trln
+121.734 Mlrd.
4.61%
1 Jan 1999 Jahr
2.817 Trln
+54.802 Mlrd.
1.98%
1 Jan 2000 Jahr
2.844 Trln
+26.332 Mlrd.
0.93%
1 Jan 2001 Jahr
2.947 Trln
+103.625 Mlrd.
3.64%
1 Jan 2002 Jahr
2.979 Trln
+32.094 Mlrd.
1.09%
1 Jan 2003 Jahr
2.985 Trln
+5.912 Mlrd.
0.2%
1 Jan 2004 Jahr
3.023 Trln
+37.49 Mlrd.
1.26%
1 Jan 2005 Jahr
3.18 Trln
+156.717 Mlrd.
5.18%
1 Jan 2006 Jahr
3.34 Trln
+160.203 Mlrd.
5.04%
1 Jan 2007 Jahr
3.54 Trln
+199.888 Mlrd.
5.99%
1 Jan 2008 Jahr
3.759 Trln
+219.343 Mlrd.
6.2%
1 Jan 2009 Jahr
3.925 Trln
+166.125 Mlrd.
4.42%
1 Jan 2010 Jahr
3.942 Trln
+16.901 Mlrd.
0.43%
1 Jan 2011 Jahr
4.159 Trln
+216.637 Mlrd.
5.5%
1 Jan 2012 Jahr
4.357 Trln
+198.681 Mlrd.
4.78%
1 Jan 2013 Jahr
4.526 Trln
+169.006 Mlrd.
3.88%
1 Jan 2014 Jahr
4.675 Trln
+148.729 Mlrd.
3.29%
1 Jan 2015 Jahr
4.731 Trln
+55.928 Mlrd.
1.2%
1 Jan 2016 Jahr
4.744 Trln
+12.907 Mlrd.
0.27%
Bewertung der Länder gemäß mit laufender Statistik nach Jahren


Kommentare: