29
/de/
de
AIzaSyAYiBZKx7MnpbEhh9jyipgxe19OcubqV5w
April 1, 2024
40862
Late-demographic dividend
LTE
false
2
1
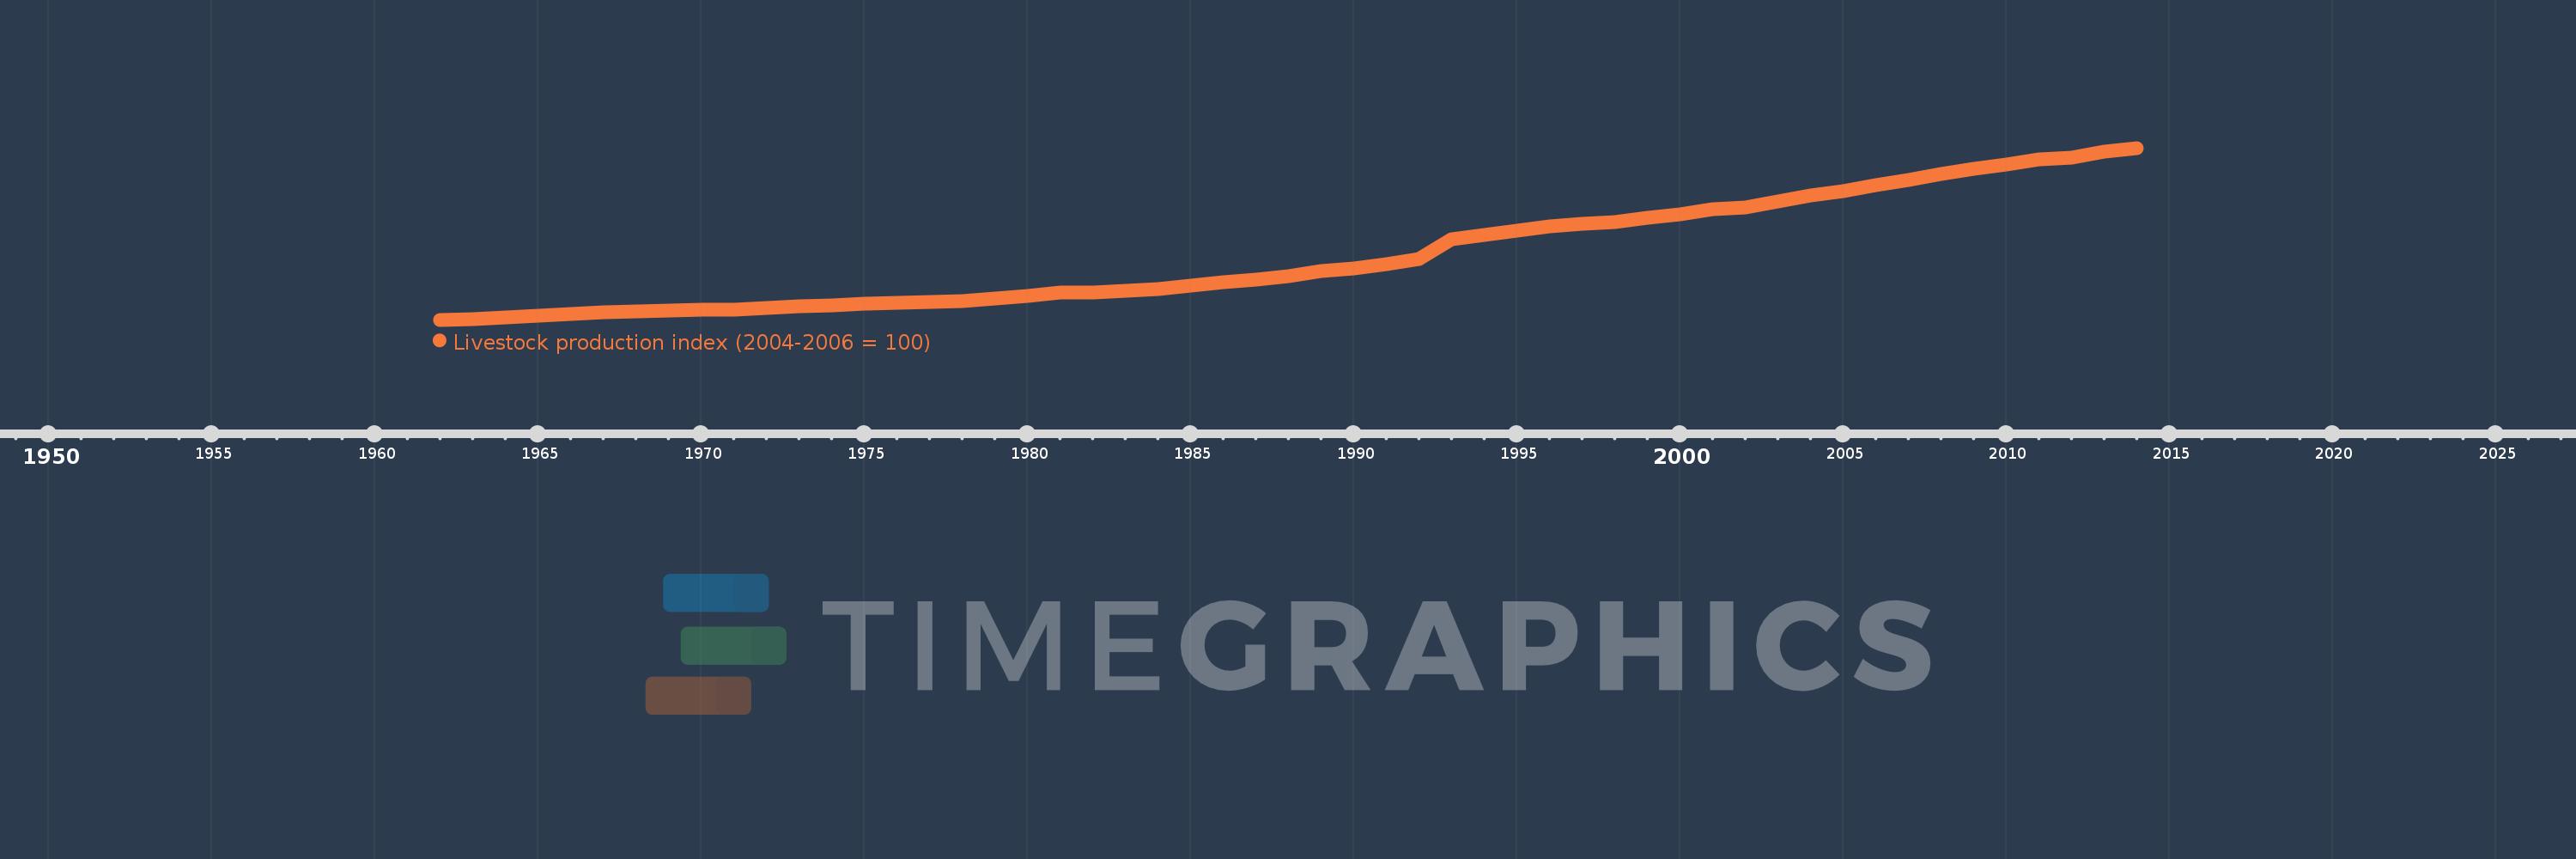
Livestock production index (2004-2006 = 100)
2014,2013,2012,2011,2010,2009,2008,2007,2006,2005,2004,2003,2002,2001,2000,1999,1998,1997,1996,1995,1994,1993,1992,1991,1990,1989,1988,1987,1986,1985,1984,1983,1982,1981,1980,1979,1978,1977,1976,1975,1974,1973,1972,1971,1970,1969,1968,1967,1966,1965,1964,1963,1962
Diese Statistik in anderen Ländern:
AfghanistanAlbaniaAlgeriaAmerican SamoaAngolaAntigua and BarbudaArab WorldArgentinaArmeniaAustraliaAustriaAzerbaijanBahamas, TheBahrainBangladeshBarbadosBelarusBelgiumBelizeBeninBermudaBhutanBoliviaBosnia and HerzegovinaBotswanaBrazilBritish Virgin IslandsBrunei DarussalamBulgariaBurkina FasoBurundiCabo VerdeCambodiaCameroonCanadaCaribbean small statesCayman IslandsCentral African RepublicCentral Europe and the BalticsChadChileChinaColombiaComorosCongo, Dem. Rep.Congo, Rep.Costa RicaCote d'IvoireCroatiaCubaCyprusCzech RepublicDenmarkDjiboutiDominicaDominican RepublicEarly-demographic dividendEast Asia & PacificEast Asia & Pacific (excluding high income)East Asia & Pacific (IDA & IBRD countries)EcuadorEgypt, Arab Rep.El SalvadorEquatorial GuineaEritreaEstoniaEthiopiaEuro areaEurope & Central AsiaEurope & Central Asia (excluding high income)Europe & Central Asia (IDA & IBRD countries)European UnionFaroe IslandsFijiFinlandFragile and conflict affected situationsFranceFrench PolynesiaGabonGambia, TheGeorgiaGermanyGhanaGreeceGreenlandGrenadaGuamGuatemalaGuineaGuinea-BissauGuyanaHaitiHeavily indebted poor countries (HIPC)High incomeHondurasHong Kong SAR, ChinaHungaryIBRD onlyIcelandIDA & IBRD totalIDA blendIDA onlyIDA totalIndiaIndonesiaIran, Islamic Rep.IraqIrelandIsraelItalyJamaicaJapanJordanKazakhstanKenyaKiribatiKorea, Dem. People’s Rep.Korea, Rep.KuwaitKyrgyz RepublicLao PDRLate-demographic dividendLatin America & Caribbean Latin America & Caribbean (excluding high income)Latin America & the Caribbean (IDA & IBRD countries)LatviaLeast developed countries: UN classificationLebanonLesothoLiberiaLibyaLiechtensteinLithuaniaLow & middle incomeLow incomeLower middle incomeLuxembourgMacao SAR, ChinaMacedonia, FYRMadagascarMalawiMalaysiaMaldivesMaliMaltaMauritaniaMauritiusMexicoMicronesia, Fed. Sts.Middle East & North AfricaMiddle East & North Africa (excluding high income)Middle East & North Africa (IDA & IBRD countries)Middle incomeMoldovaMongoliaMontenegroMoroccoMozambiqueMyanmarNamibiaNauruNepalNetherlandsNew CaledoniaNew ZealandNicaraguaNigerNigeriaNorth AmericaNorwayOECD membersOmanOther small statesPacific island small statesPakistanPanamaPapua New GuineaParaguayPeruPhilippinesPolandPortugalPost-demographic dividendPre-demographic dividendPuerto RicoQatarRomaniaRussian FederationRwandaSamoaSao Tome and PrincipeSaudi ArabiaSenegalSerbiaSeychellesSierra LeoneSingaporeSlovak RepublicSloveniaSmall statesSolomon IslandsSomaliaSouth AfricaSouth AsiaSouth Asia (IDA & IBRD)SpainSri LankaSt. Kitts and NevisSt. LuciaSt. Vincent and the GrenadinesSub-Saharan Africa Sub-Saharan Africa (excluding high income)Sub-Saharan Africa (IDA & IBRD countries)SudanSurinameSwazilandSwedenSwitzerlandSyrian Arab RepublicTajikistanTanzaniaThailandTimor-LesteTogoTongaTrinidad and TobagoTunisiaTurkeyTurkmenistanTuvaluUgandaUkraineUnited Arab EmiratesUnited KingdomUnited StatesUpper middle incomeUruguayUzbekistanVanuatuVenezuela, RBVietnamVirgin Islands (U.S.)West Bank and GazaWorldYemen, Rep.ZambiaZimbabwe Zeitlinie:
Diese Zeitleiste vorliegt die Graphik ab 1962 J. bis 2014 J. Late-demographic dividend. Die Angaben bis 1961 J. sind nicht vorhanden. Die Zahl aktueller Beobachtungen nach Daten: 53.
Die Quelle (Bezeichnung):
Kennzahlen der Weltentwicklung
Die Quelle (Einrichtung):
Food and Agriculture Organization, electronic files and web site.
Kategorien:
Agriculture & Rural Development
Es wurde aktualisiert:
23 Apr 2017 Jahr
Kennzahlen der Wertänderungen vom Jahr zum Jahr
Minimum:
13.635
1 Jan 1962 Jahr
Maximum:
124.262
1 Jan 2014 Jahr
Zum Datum der Beobachtung
Wert
Absolute Veränderung
Die Veränderung bezüglich dem vorherigen Wert
1 Jan 1962 Jahr
13.635
+13.635
0.0%
1 Jan 1963 Jahr
14.124
+0.489
3.59%
1 Jan 1964 Jahr
15.124
+1.0
7.08%
1 Jan 1965 Jahr
16.457
+1.333
8.82%
1 Jan 1966 Jahr
17.49
+1.032
6.27%
1 Jan 1967 Jahr
18.249
+0.759
4.34%
1 Jan 1968 Jahr
18.923
+0.674
3.69%
1 Jan 1969 Jahr
19.501
+0.578
3.05%
1 Jan 1970 Jahr
19.836
+0.335
1.72%
1 Jan 1971 Jahr
20.171
+0.335
1.69%
1 Jan 1972 Jahr
20.963
+0.792
3.92%
1 Jan 1973 Jahr
22.28
+1.317
6.28%
1 Jan 1974 Jahr
22.976
+0.696
3.12%
1 Jan 1975 Jahr
23.789
+0.814
3.54%
1 Jan 1976 Jahr
24.791
+1.001
4.21%
1 Jan 1977 Jahr
25.287
+0.497
2.0%
1 Jan 1978 Jahr
25.704
+0.417
1.65%
1 Jan 1979 Jahr
27.122
+1.418
5.52%
1 Jan 1980 Jahr
29.127
+2.005
7.39%
1 Jan 1981 Jahr
30.936
+1.81
6.21%
1 Jan 1982 Jahr
31.231
+0.295
0.95%
1 Jan 1983 Jahr
32.23
+0.999
3.2%
1 Jan 1984 Jahr
33.286
+1.056
3.28%
1 Jan 1985 Jahr
35.723
+2.437
7.32%
1 Jan 1986 Jahr
37.824
+2.101
5.88%
1 Jan 1987 Jahr
39.433
+1.609
4.25%
1 Jan 1988 Jahr
41.807
+2.374
6.02%
1 Jan 1989 Jahr
44.739
+2.932
7.01%
1 Jan 1990 Jahr
46.527
+1.788
4.0%
1 Jan 1991 Jahr
49.339
+2.812
6.04%
1 Jan 1992 Jahr
52.751
+3.411
6.91%
1 Jan 1993 Jahr
65.562
+12.812
24.29%
1 Jan 1994 Jahr
68.012
+2.449
3.74%
1 Jan 1995 Jahr
70.753
+2.742
4.03%
1 Jan 1996 Jahr
73.561
+2.808
3.97%
1 Jan 1997 Jahr
75.424
+1.863
2.53%
1 Jan 1998 Jahr
76.37
+0.946
1.25%
1 Jan 1999 Jahr
79.515
+3.145
4.12%
1 Jan 2000 Jahr
81.71
+2.195
2.76%
1 Jan 2001 Jahr
84.921
+3.212
3.93%
1 Jan 2002 Jahr
86.2
+1.278
1.51%
1 Jan 2003 Jahr
89.567
+3.367
3.91%
1 Jan 2004 Jahr
93.544
+3.977
4.44%
1 Jan 2005 Jahr
96.386
+2.842
3.04%
1 Jan 2006 Jahr
100.141
+3.755
3.9%
1 Jan 2007 Jahr
103.454
+3.313
3.31%
1 Jan 2008 Jahr
107.35
+3.896
3.77%
1 Jan 2009 Jahr
110.817
+3.466
3.23%
1 Jan 2010 Jahr
113.442
+2.625
2.37%
1 Jan 2011 Jahr
116.757
+3.314
2.92%
1 Jan 2012 Jahr
117.978
+1.221
1.05%
1 Jan 2013 Jahr
121.839
+3.861
3.27%
1 Jan 2014 Jahr
124.262
+2.423
1.99%
Bewertung der Länder gemäß mit laufender Statistik nach Jahren


Kommentare: