29
/de/
de
AIzaSyAYiBZKx7MnpbEhh9jyipgxe19OcubqV5w
April 1, 2024
40134
IDA total
IDA
false
2
1
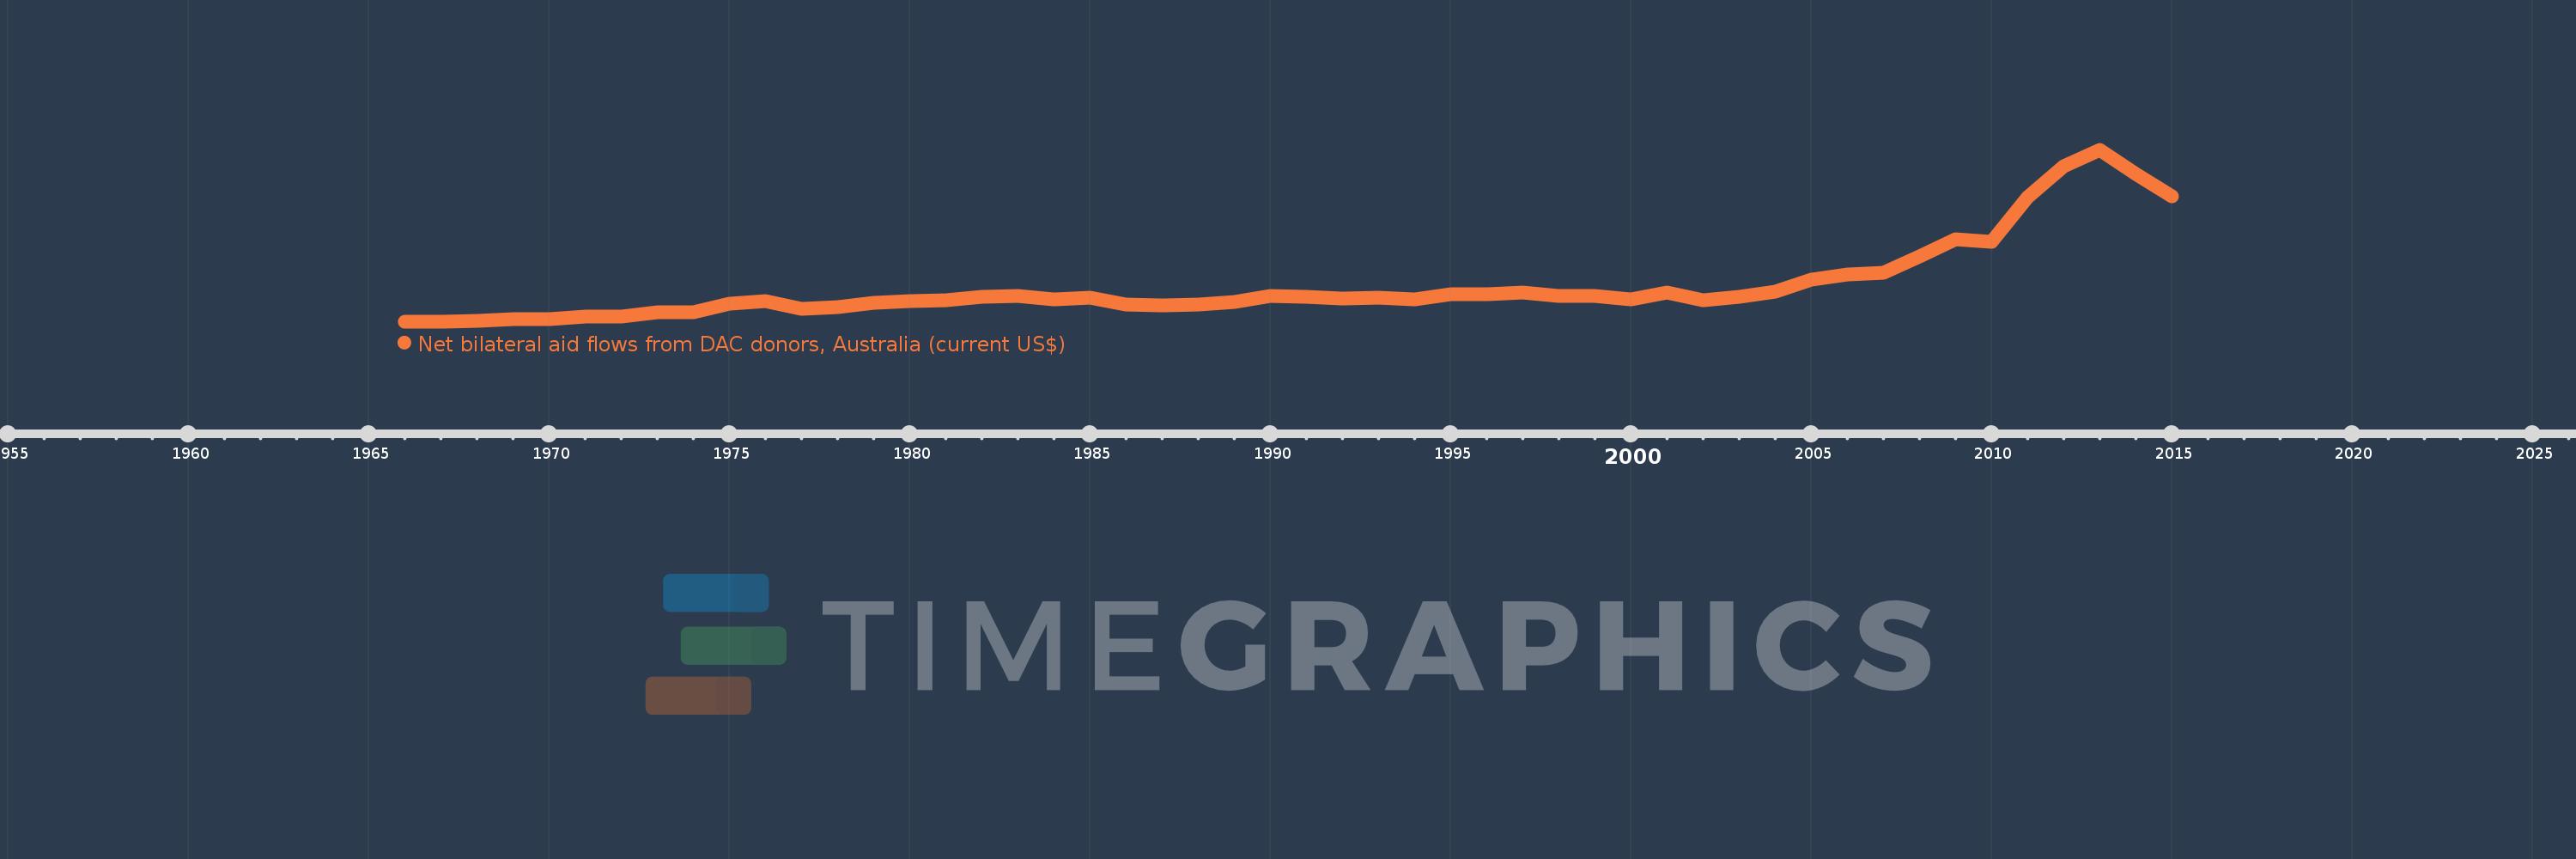
Net bilateral aid flows from DAC donors, Australia (current US$)
2015,2014,2013,2012,2011,2010,2009,2008,2007,2006,2005,2004,2003,2002,2001,2000,1999,1998,1997,1996,1995,1994,1993,1992,1991,1990,1989,1988,1987,1986,1985,1984,1983,1982,1981,1980,1979,1978,1977,1976,1975,1974,1973,1972,1971,1970,1969,1968,1967,1966
Diese Statistik in anderen Ländern:
AfghanistanAlbaniaAlgeriaAngolaAntigua and BarbudaArab WorldArgentinaArmeniaAzerbaijanBahamas, TheBahrainBangladeshBarbadosBelarusBelizeBeninBhutanBoliviaBosnia and HerzegovinaBotswanaBrazilBrunei DarussalamBulgariaBurkina FasoBurundiCabo VerdeCambodiaCameroonCaribbean small statesCayman IslandsCentral African RepublicCentral Europe and the BalticsChadChileChinaColombiaComorosCongo, Dem. Rep.Congo, Rep.Costa RicaCote d'IvoireCroatiaCubaCyprusCzech RepublicDjiboutiDominicaDominican RepublicEast Asia & PacificEast Asia & Pacific (excluding high income)East Asia & Pacific (IDA & IBRD countries)EcuadorEgypt, Arab Rep.El SalvadorEquatorial GuineaEritreaEstoniaEthiopiaEuro areaEurope & Central AsiaEurope & Central Asia (excluding high income)Europe & Central Asia (IDA & IBRD countries)European UnionFijiFragile and conflict affected situationsFrench PolynesiaGabonGambia, TheGeorgiaGhanaGrenadaGuatemalaGuineaGuinea-BissauGuyanaHaitiHeavily indebted poor countries (HIPC)High incomeHondurasHong Kong SAR, ChinaHungaryIBRD onlyIDA & IBRD totalIDA blendIDA onlyIDA totalIndiaIndonesiaIran, Islamic Rep.IraqIsraelJamaicaJordanKazakhstanKenyaKiribatiKorea, Dem. People’s Rep.Korea, Rep.KuwaitKyrgyz RepublicLao PDRLatin America & Caribbean Latin America & Caribbean (excluding high income)Latin America & the Caribbean (IDA & IBRD countries)LatviaLeast developed countries: UN classificationLebanonLesothoLiberiaLibyaLithuaniaLow & middle incomeLow incomeLower middle incomeMacao SAR, ChinaMacedonia, FYRMadagascarMalawiMalaysiaMaldivesMaliMaltaMarshall IslandsMauritaniaMauritiusMexicoMicronesia, Fed. Sts.Middle East & North AfricaMiddle East & North Africa (excluding high income)Middle East & North Africa (IDA & IBRD countries)Middle incomeMoldovaMongoliaMontenegroMoroccoMozambiqueMyanmarNamibiaNauruNepalNew CaledoniaNicaraguaNigerNigeriaNorthern Mariana IslandsOECD membersOmanOther small statesPacific island small statesPakistanPalauPanamaPapua New GuineaParaguayPeruPhilippinesPolandRomaniaRussian FederationRwandaSamoaSao Tome and PrincipeSaudi ArabiaSenegalSerbiaSeychellesSierra LeoneSingaporeSlovak RepublicSloveniaSmall statesSolomon IslandsSomaliaSouth AfricaSouth AsiaSouth Asia (IDA & IBRD)South SudanSri LankaSt. Kitts and NevisSt. LuciaSt. Vincent and the GrenadinesSub-Saharan Africa Sub-Saharan Africa (excluding high income)Sub-Saharan Africa (IDA & IBRD countries)SudanSurinameSwazilandSyrian Arab RepublicTajikistanTanzaniaThailandTimor-LesteTogoTongaTrinidad and TobagoTunisiaTurkeyTurkmenistanTurks and Caicos IslandsTuvaluUgandaUkraineUpper middle incomeUruguayUzbekistanVanuatuVenezuela, RBVietnamWest Bank and GazaWorldYemen, Rep.ZambiaZimbabwe Zeitlinie:
Diese Zeitleiste vorliegt die Graphik ab 1966 J. bis 2015 J. IDA total. Die Angaben bis 1965 J. sind nicht vorhanden. Die Zahl aktueller Beobachtungen nach Daten: 50.
Die Quelle (Bezeichnung):
Kennzahlen der Weltentwicklung
Die Quelle (Einrichtung):
Development Assistance Committee of the Organisation for Economic Co-operation and Development, Geographical Distribution of Financial Flows to Developing Countries, Development Co-operation Report, and International Development Statistics database. Data are available online at: www.oecd.org/dac/stats/idsonline.
Kategorien:
Aid Effectiveness
Es wurde aktualisiert:
23 Apr 2017 Jahr
Kennzahlen der Wertänderungen vom Jahr zum Jahr
im Durchschnitt:
548.861 Mln.
Minimum:
89.58 Mln.
1 Jan 1966 Jahr
Maximum:
2.258 Mlrd.
1 Jan 2013 Jahr
Zum Datum der Beobachtung
Wert
Absolute Veränderung
Die Veränderung bezüglich dem vorherigen Wert
1 Jan 1966 Jahr
89.58 Mln.
+89.58 Mln.
0.0%
1 Jan 1967 Jahr
94.03 Mln.
+4.45 Mln.
4.97%
1 Jan 1968 Jahr
106.46 Mln.
+12.43 Mln.
13.22%
1 Jan 1969 Jahr
120.93 Mln.
+14.47 Mln.
13.59%
1 Jan 1970 Jahr
127.95 Mln.
+7.02 Mln.
5.81%
1 Jan 1971 Jahr
158.4 Mln.
+30.45 Mln.
23.8%
1 Jan 1972 Jahr
153.97 Mln.
-4.43 Mln.
-2.8%
1 Jan 1973 Jahr
214.48 Mln.
+60.51 Mln.
39.3%
1 Jan 1974 Jahr
216.75 Mln.
+2.27 Mln.
1.06%
1 Jan 1975 Jahr
325.67 Mln.
+108.92 Mln.
50.25%
1 Jan 1976 Jahr
350.64 Mln.
+24.97 Mln.
7.67%
1 Jan 1977 Jahr
254.92 Mln.
-95.72 Mln.
-27.3%
1 Jan 1978 Jahr
279.1 Mln.
+24.18 Mln.
9.49%
1 Jan 1979 Jahr
332.03 Mln.
+52.93 Mln.
18.96%
1 Jan 1980 Jahr
353.62 Mln.
+21.59 Mln.
6.5%
1 Jan 1981 Jahr
359.89 Mln.
+6.27 Mln.
1.77%
1 Jan 1982 Jahr
405.85 Mln.
+45.96 Mln.
12.77%
1 Jan 1983 Jahr
417.09 Mln.
+11.24 Mln.
2.77%
1 Jan 1984 Jahr
375.21 Mln.
-41.88 Mln.
-10.04%
1 Jan 1985 Jahr
391.09 Mln.
+15.88 Mln.
4.23%
1 Jan 1986 Jahr
306.33 Mln.
-84.76 Mln.
-21.67%
1 Jan 1987 Jahr
298.31 Mln.
-8.02 Mln.
-2.62%
1 Jan 1988 Jahr
309.59 Mln.
+11.28 Mln.
3.78%
1 Jan 1989 Jahr
341.53 Mln.
+31.94 Mln.
10.32%
1 Jan 1990 Jahr
417.48 Mln.
+75.95 Mln.
22.24%
1 Jan 1991 Jahr
403.24 Mln.
-14.24 Mln.
-3.41%
1 Jan 1992 Jahr
387.9 Mln.
-15.34 Mln.
-3.8%
1 Jan 1993 Jahr
392.07 Mln.
+4.17 Mln.
1.08%
1 Jan 1994 Jahr
372.42 Mln.
-19.65 Mln.
-5.01%
1 Jan 1995 Jahr
437.62 Mln.
+65.2 Mln.
17.51%
1 Jan 1996 Jahr
444.41 Mln.
+6.79 Mln.
1.55%
1 Jan 1997 Jahr
464.02 Mln.
+19.61 Mln.
4.41%
1 Jan 1998 Jahr
418.8 Mln.
-45.22 Mln.
-9.75%
1 Jan 1999 Jahr
422.06 Mln.
+3.26 Mln.
0.78%
1 Jan 2000 Jahr
376.87 Mln.
-45.19 Mln.
-10.71%
1 Jan 2001 Jahr
460.68 Mln.
+83.81 Mln.
22.24%
1 Jan 2002 Jahr
367.61 Mln.
-93.07 Mln.
-20.2%
1 Jan 2003 Jahr
411.15 Mln.
+43.54 Mln.
11.84%
1 Jan 2004 Jahr
474.71 Mln.
+63.56 Mln.
15.46%
1 Jan 2005 Jahr
628.64 Mln.
+153.93 Mln.
32.43%
1 Jan 2006 Jahr
689.67 Mln.
+61.03 Mln.
9.71%
1 Jan 2007 Jahr
712.08 Mln.
+22.41 Mln.
3.25%
1 Jan 2008 Jahr
919.01 Mln.
+206.93 Mln.
29.06%
1 Jan 2009 Jahr
1.136 Mlrd.
+216.93 Mln.
23.6%
1 Jan 2010 Jahr
1.106 Mlrd.
-29.72 Mln.
-2.62%
1 Jan 2011 Jahr
1.67 Mlrd.
+563.34 Mln.
50.92%
1 Jan 2012 Jahr
2.058 Mlrd.
+388.67 Mln.
23.28%
1 Jan 2013 Jahr
2.258 Mlrd.
+199.8 Mln.
9.71%
1 Jan 2014 Jahr
1.958 Mlrd.
-300.39 Mln.
-13.3%
1 Jan 2015 Jahr
1.674 Mlrd.
-284.09 Mln.
-14.51%
Bewertung der Länder gemäß mit laufender Statistik nach Jahren


Kommentare: