29
/de/
de
AIzaSyAYiBZKx7MnpbEhh9jyipgxe19OcubqV5w
April 1, 2024
37982
IDA blend
IDB
false
2
1
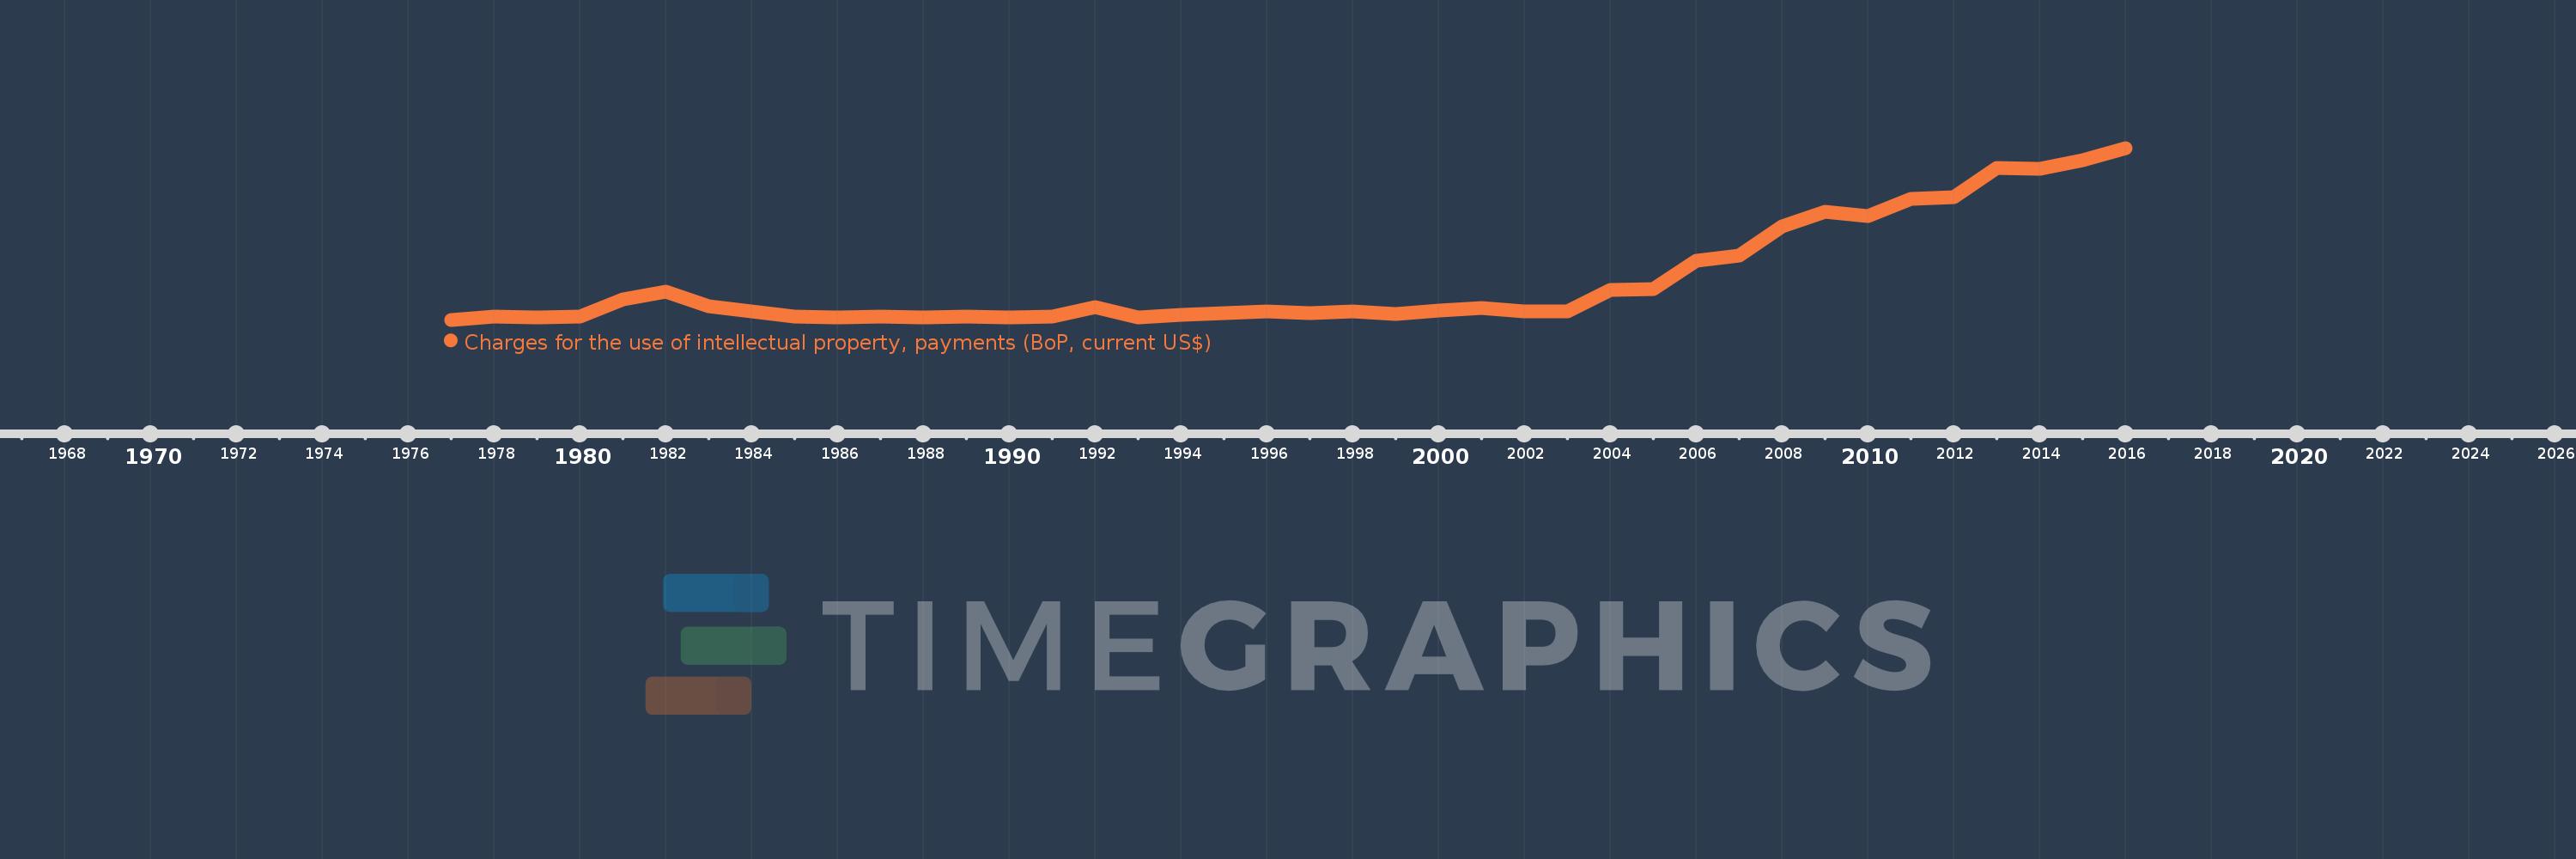
Charges for the use of intellectual property, payments (BoP, current US$)
2016,2015,2014,2013,2012,2011,2010,2009,2008,2007,2006,2005,2004,2003,2002,2001,2000,1999,1998,1997,1996,1995,1994,1993,1992,1991,1990,1989,1988,1987,1986,1985,1984,1983,1982,1981,1980,1979,1978,1977
Diese Statistik in anderen Ländern:
Zeitlinie:
Diese Zeitleiste vorliegt die Graphik ab 1977 J. bis 2016 J. IDA blend. Die Angaben bis 1976 J. sind nicht vorhanden. Die Zahl aktueller Beobachtungen nach Daten: 40.
Die Quelle (Bezeichnung):
Kennzahlen der Weltentwicklung
Die Quelle (Einrichtung):
International Monetary Fund, Balance of Payments Statistics Yearbook and data files.
Kategorien:
Economy & Growth, Science & Technology
Es wurde aktualisiert:
23 Apr 2017 Jahr
Kennzahlen der Wertänderungen vom Jahr zum Jahr
im Durchschnitt:
133.469 Mln.
Minimum:
1.65 Mln.
1 Jan 1977 Jahr
Maximum:
583.283 Mln.
1 Jan 2016 Jahr
Zum Datum der Beobachtung
Wert
Absolute Veränderung
Die Veränderung bezüglich dem vorherigen Wert
1 Jan 1977 Jahr
1.65 Mln.
+1.65 Mln.
0.0%
1 Jan 1978 Jahr
11.053 Mln.
+9.402 Mln.
569.78%
1 Jan 1979 Jahr
9.8 Mln.
-1.253 Mln.
-11.34%
1 Jan 1980 Jahr
12.087 Mln.
+2.287 Mln.
23.34%
1 Jan 1981 Jahr
70.504 Mln.
+58.417 Mln.
483.32%
1 Jan 1982 Jahr
97.696 Mln.
+27.192 Mln.
38.57%
1 Jan 1983 Jahr
46.766 Mln.
-50.93 Mln.
-52.13%
1 Jan 1984 Jahr
30.738 Mln.
-16.028 Mln.
-34.27%
1 Jan 1985 Jahr
13.033 Mln.
-17.705 Mln.
-57.6%
1 Jan 1986 Jahr
9.564 Mln.
-3.468 Mln.
-26.61%
1 Jan 1987 Jahr
11.342 Mln.
+1.778 Mln.
18.58%
1 Jan 1988 Jahr
10.839 Mln.
-502.559 Tsnd.
-4.43%
1 Jan 1989 Jahr
11.344 Mln.
+504.868 Tsnd.
4.66%
1 Jan 1990 Jahr
9.075 Mln.
-2.27 Mln.
-20.01%
1 Jan 1991 Jahr
12.193 Mln.
+3.118 Mln.
34.36%
1 Jan 1992 Jahr
45.277 Mln.
+33.084 Mln.
271.35%
1 Jan 1993 Jahr
10.6 Mln.
-34.677 Mln.
-76.59%
1 Jan 1994 Jahr
17.681 Mln.
+7.081 Mln.
66.81%
1 Jan 1995 Jahr
24.328 Mln.
+6.647 Mln.
37.59%
1 Jan 1996 Jahr
29.116 Mln.
+4.788 Mln.
19.68%
1 Jan 1997 Jahr
23.053 Mln.
-6.063 Mln.
-20.82%
1 Jan 1998 Jahr
29.688 Mln.
+6.635 Mln.
28.78%
1 Jan 1999 Jahr
20.274 Mln.
-9.414 Mln.
-31.71%
1 Jan 2000 Jahr
33.486 Mln.
+13.213 Mln.
65.17%
1 Jan 2001 Jahr
42.257 Mln.
+8.771 Mln.
26.19%
1 Jan 2002 Jahr
30.086 Mln.
-12.171 Mln.
-28.8%
1 Jan 2003 Jahr
28.785 Mln.
-1.301 Mln.
-4.33%
1 Jan 2004 Jahr
101.975 Mln.
+73.19 Mln.
254.27%
1 Jan 2005 Jahr
104.114 Mln.
+2.139 Mln.
2.1%
1 Jan 2006 Jahr
202.116 Mln.
+98.002 Mln.
94.13%
1 Jan 2007 Jahr
219.512 Mln.
+17.395 Mln.
8.61%
1 Jan 2008 Jahr
316.987 Mln.
+97.475 Mln.
44.41%
1 Jan 2009 Jahr
366.965 Mln.
+49.978 Mln.
15.77%
1 Jan 2010 Jahr
352.908 Mln.
-14.057 Mln.
-3.83%
1 Jan 2011 Jahr
412.181 Mln.
+59.273 Mln.
16.8%
1 Jan 2012 Jahr
415.515 Mln.
+3.334 Mln.
0.81%
1 Jan 2013 Jahr
516.385 Mln.
+100.871 Mln.
24.28%
1 Jan 2014 Jahr
513.817 Mln.
-2.569 Mln.
-0.5%
1 Jan 2015 Jahr
540.695 Mln.
+26.878 Mln.
5.23%
1 Jan 2016 Jahr
583.283 Mln.
+42.588 Mln.
7.88%
Bewertung der Länder gemäß mit laufender Statistik nach Jahren


Kommentare: