29
/de/
de
AIzaSyAYiBZKx7MnpbEhh9jyipgxe19OcubqV5w
April 1, 2024
37526
IDA & IBRD total
IBT
false
2
1
Lower secondary completion rate, male (% of relevant age group)
2015,2014,2013,2012,2011,2010,2009,2008,2007,2006,2005,2004,2003,2002,2001,2000,1999,1998,1997,1996,1995,1994,1993,1992,1991,1990,1989,1988,1987
Diese Statistik in anderen Ländern:
AfghanistanAlbaniaAlgeriaAngolaAntigua and BarbudaArab WorldArgentinaArmeniaArubaAustriaAzerbaijanBahamas, TheBahrainBangladeshBarbadosBelarusBelgiumBelizeBeninBermudaBhutanBoliviaBosnia and HerzegovinaBotswanaBrunei DarussalamBulgariaBurkina FasoBurundiCabo VerdeCambodiaCameroonCaribbean small statesCentral African RepublicCentral Europe and the BalticsChadChileChinaColombiaComorosCongo, Dem. Rep.Congo, Rep.Costa RicaCote d'IvoireCroatiaCubaCyprusCzech RepublicDenmarkDjiboutiDominicaDominican RepublicEarly-demographic dividendEast Asia & PacificEast Asia & Pacific (excluding high income)East Asia & Pacific (IDA & IBRD countries)EcuadorEgypt, Arab Rep.El SalvadorEquatorial GuineaEritreaEstoniaEthiopiaEuro areaEurope & Central AsiaEurope & Central Asia (excluding high income)Europe & Central Asia (IDA & IBRD countries)European UnionFijiFinlandFragile and conflict affected situationsFranceGabonGambia, TheGeorgiaGermanyGhanaGreeceGrenadaGuatemalaGuineaGuinea-BissauGuyanaHaitiHeavily indebted poor countries (HIPC)High incomeHondurasHong Kong SAR, ChinaHungaryIBRD onlyIcelandIDA & IBRD totalIDA blendIDA onlyIDA totalIndiaIndonesiaIran, Islamic Rep.IraqIrelandIsraelItalyJamaicaJapanJordanKazakhstanKenyaKiribatiKorea, Dem. People’s Rep.Korea, Rep.KuwaitKyrgyz RepublicLao PDRLate-demographic dividendLatin America & Caribbean Latin America & Caribbean (excluding high income)Latin America & the Caribbean (IDA & IBRD countries)LatviaLeast developed countries: UN classificationLebanonLesothoLiberiaLiechtensteinLithuaniaLow & middle incomeLow incomeLower middle incomeLuxembourgMacao SAR, ChinaMacedonia, FYRMadagascarMalawiMaldivesMaliMaltaMarshall IslandsMauritaniaMauritiusMexicoMiddle East & North AfricaMiddle East & North Africa (excluding high income)Middle East & North Africa (IDA & IBRD countries)Middle incomeMoldovaMongoliaMontenegroMoroccoMozambiqueMyanmarNamibiaNauruNepalNetherlandsNicaraguaNigerNorwayOECD membersOmanOther small statesPacific island small statesPakistanPalauPanamaPapua New GuineaParaguayPeruPhilippinesPolandPortugalPost-demographic dividendPre-demographic dividendQatarRomaniaRussian FederationRwandaSamoaSan MarinoSao Tome and PrincipeSaudi ArabiaSenegalSerbiaSeychellesSierra LeoneSlovak RepublicSloveniaSmall statesSolomon IslandsSouth AfricaSouth AsiaSouth Asia (IDA & IBRD)South SudanSpainSri LankaSt. Kitts and NevisSt. LuciaSt. Vincent and the GrenadinesSub-Saharan Africa Sub-Saharan Africa (excluding high income)Sub-Saharan Africa (IDA & IBRD countries)SudanSurinameSwazilandSwedenSwitzerlandSyrian Arab RepublicTajikistanTanzaniaThailandTimor-LesteTogoTongaTrinidad and TobagoTunisiaTurkeyTuvaluUgandaUkraineUnited Arab EmiratesUpper middle incomeUruguayUzbekistanVanuatuVenezuela, RBVietnamWest Bank and GazaWorldYemen, Rep.ZambiaZimbabwe Zeitlinie:
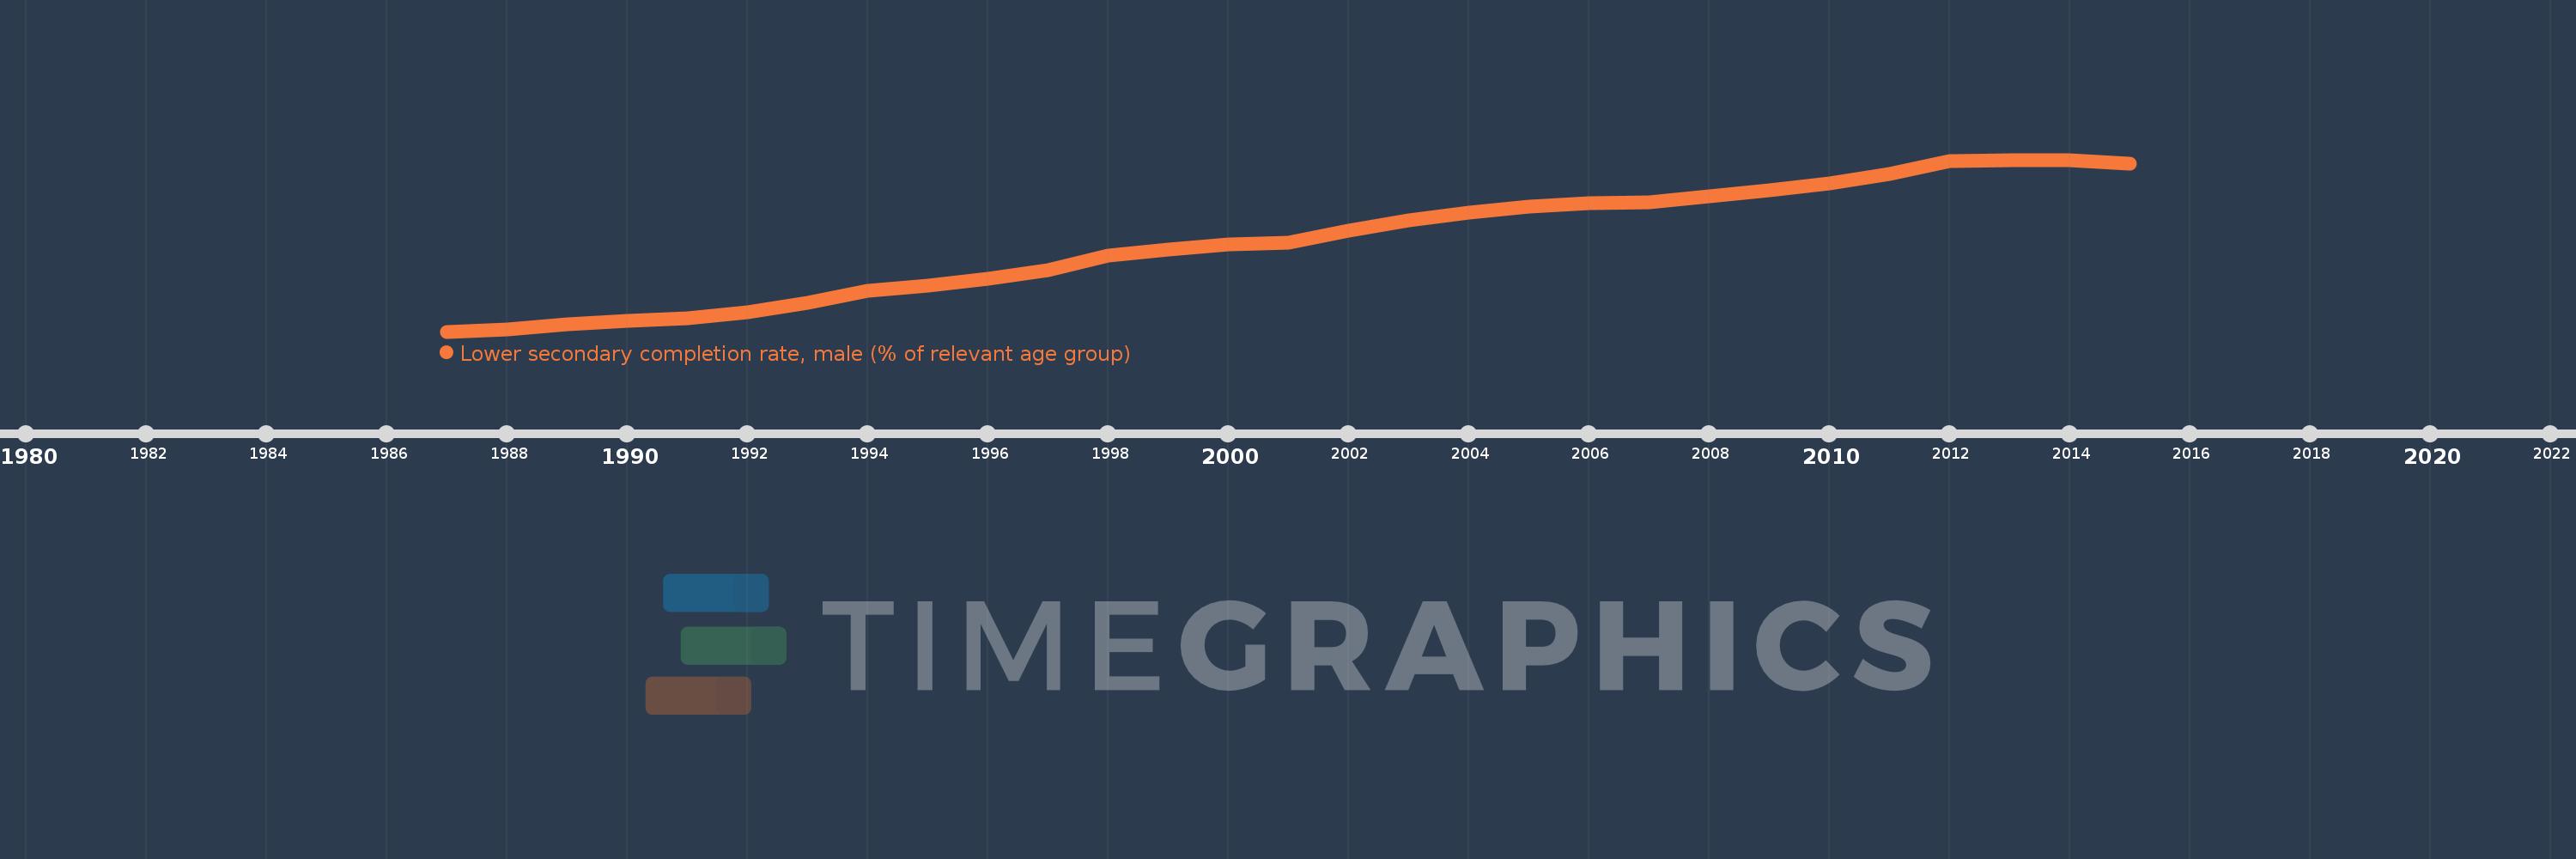
Diese Zeitleiste vorliegt die Graphik ab 1987 J. bis 2015 J. IDA & IBRD total. Die Angaben bis 1986 J. sind nicht vorhanden. Die Zahl aktueller Beobachtungen nach Daten: 29.
Die Quelle (Bezeichnung):
Kennzahlen der Weltentwicklung
Die Quelle (Einrichtung):
United Nations Educational, Scientific, and Cultural Organization (UNESCO) Institute for Statistics.
Kategorien:
Education
Es wurde aktualisiert:
23 Apr 2017 Jahr
Kennzahlen der Wertänderungen vom Jahr zum Jahr
Minimum:
50.594
1 Jan 1987 Jahr
Maximum:
73.45
1 Jan 2014 Jahr
Zum Datum der Beobachtung
Wert
Absolute Veränderung
Die Veränderung bezüglich dem vorherigen Wert
1 Jan 1987 Jahr
50.594
+50.594
0.0%
1 Jan 1988 Jahr
50.933
+0.339
0.67%
1 Jan 1989 Jahr
51.595
+0.662
1.3%
1 Jan 1990 Jahr
52.038
+0.442
0.86%
1 Jan 1991 Jahr
52.393
+0.355
0.68%
1 Jan 1992 Jahr
53.136
+0.743
1.42%
1 Jan 1993 Jahr
54.452
+1.316
2.48%
1 Jan 1994 Jahr
55.986
+1.534
2.82%
1 Jan 1995 Jahr
56.673
+0.687
1.23%
1 Jan 1996 Jahr
57.679
+1.006
1.78%
1 Jan 1997 Jahr
58.737
+1.058
1.83%
1 Jan 1998 Jahr
60.737
+2.0
3.4%
1 Jan 1999 Jahr
61.47
+0.734
1.21%
1 Jan 2000 Jahr
62.208
+0.737
1.2%
1 Jan 2001 Jahr
62.469
+0.261
0.42%
1 Jan 2002 Jahr
64.008
+1.539
2.46%
1 Jan 2003 Jahr
65.372
+1.364
2.13%
1 Jan 2004 Jahr
66.46
+1.088
1.66%
1 Jan 2005 Jahr
67.276
+0.816
1.23%
1 Jan 2006 Jahr
67.628
+0.353
0.52%
1 Jan 2007 Jahr
67.825
+0.196
0.29%
1 Jan 2008 Jahr
68.548
+0.723
1.07%
1 Jan 2009 Jahr
69.424
+0.876
1.28%
1 Jan 2010 Jahr
70.334
+0.91
1.31%
1 Jan 2011 Jahr
71.615
+1.281
1.82%
1 Jan 2012 Jahr
73.246
+1.631
2.28%
1 Jan 2013 Jahr
73.345
+0.099
0.13%
1 Jan 2014 Jahr
73.45
+0.106
0.14%
1 Jan 2015 Jahr
72.882
-0.568
-0.77%
Bewertung der Länder gemäß mit laufender Statistik nach Jahren


Kommentare: