29
/de/
de
AIzaSyAYiBZKx7MnpbEhh9jyipgxe19OcubqV5w
April 1, 2024
36183
High income
HIC
false
2
1
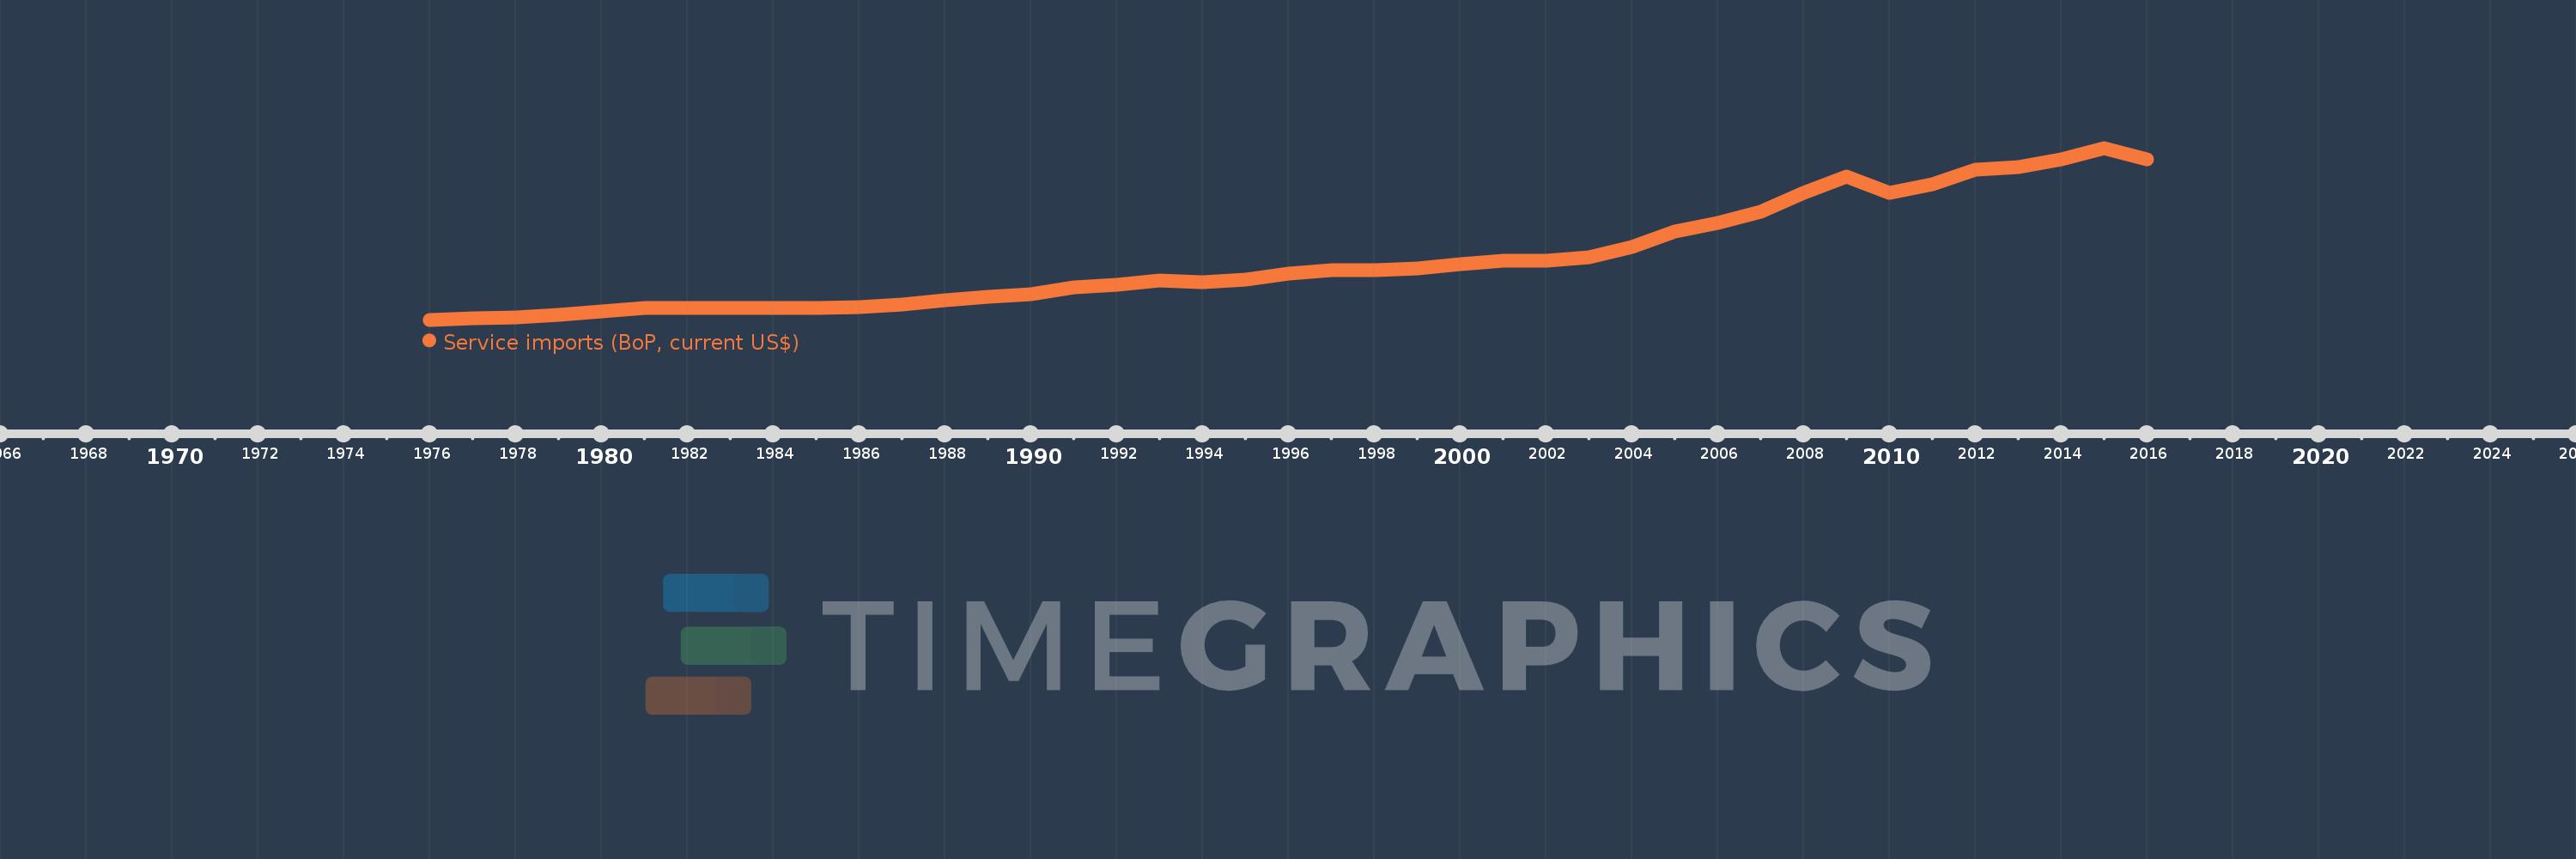
Service imports (BoP, current US$)
2016,2015,2014,2013,2012,2011,2010,2009,2008,2007,2006,2005,2004,2003,2002,2001,2000,1999,1998,1997,1996,1995,1994,1993,1992,1991,1990,1989,1988,1987,1986,1985,1984,1983,1982,1981,1980,1979,1978,1977,1976
Diese Statistik in anderen Ländern:
AfghanistanAlbaniaAlgeriaAngolaAntigua and BarbudaArab WorldArgentinaArmeniaArubaAustraliaAustriaAzerbaijanBahamas, TheBahrainBangladeshBarbadosBelarusBelgiumBelizeBeninBermudaBhutanBoliviaBosnia and HerzegovinaBotswanaBrazilBrunei DarussalamBulgariaBurkina FasoBurundiCabo VerdeCambodiaCameroonCanadaCaribbean small statesCentral African RepublicCentral Europe and the BalticsChadChileChinaColombiaComorosCongo, Dem. Rep.Congo, Rep.Costa RicaCote d'IvoireCroatiaCuracaoCyprusCzech RepublicDenmarkDjiboutiDominicaDominican RepublicEarly-demographic dividendEast Asia & PacificEast Asia & Pacific (excluding high income)East Asia & Pacific (IDA & IBRD countries)EcuadorEgypt, Arab Rep.El SalvadorEquatorial GuineaEritreaEstoniaEthiopiaEuro areaEurope & Central AsiaEurope & Central Asia (excluding high income)Europe & Central Asia (IDA & IBRD countries)European UnionFaroe IslandsFijiFinlandFragile and conflict affected situationsFranceFrench PolynesiaGabonGambia, TheGeorgiaGermanyGhanaGreeceGrenadaGuatemalaGuineaGuinea-BissauGuyanaHaitiHeavily indebted poor countries (HIPC)High incomeHondurasHong Kong SAR, ChinaHungaryIBRD onlyIcelandIDA & IBRD totalIDA blendIDA onlyIDA totalIndiaIndonesiaIran, Islamic Rep.IraqIrelandIsraelItalyJamaicaJapanJordanKazakhstanKenyaKiribatiKorea, Rep.KosovoKuwaitKyrgyz RepublicLao PDRLate-demographic dividendLatin America & Caribbean Latin America & Caribbean (excluding high income)Latin America & the Caribbean (IDA & IBRD countries)LatviaLeast developed countries: UN classificationLebanonLesothoLiberiaLibyaLithuaniaLow & middle incomeLow incomeLower middle incomeLuxembourgMacao SAR, ChinaMacedonia, FYRMadagascarMalawiMalaysiaMaldivesMaliMaltaMarshall IslandsMauritaniaMauritiusMexicoMicronesia, Fed. Sts.Middle East & North Africa (excluding high income)Middle East & North Africa (IDA & IBRD countries)Middle incomeMoldovaMongoliaMontenegroMoroccoMozambiqueMyanmarNamibiaNepalNetherlandsNew CaledoniaNew ZealandNicaraguaNigerNigeriaNorth AmericaNorwayOECD membersOmanOther small statesPacific island small statesPakistanPalauPanamaPapua New GuineaParaguayPeruPhilippinesPolandPortugalPost-demographic dividendPre-demographic dividendQatarRomaniaRussian FederationRwandaSamoaSao Tome and PrincipeSaudi ArabiaSenegalSerbiaSeychellesSierra LeoneSingaporeSint Maarten (Dutch part)Slovak RepublicSloveniaSmall statesSolomon IslandsSouth AfricaSouth AsiaSouth Asia (IDA & IBRD)South SudanSpainSri LankaSt. Kitts and NevisSt. LuciaSt. Vincent and the GrenadinesSub-Saharan Africa Sub-Saharan Africa (excluding high income)Sub-Saharan Africa (IDA & IBRD countries)SudanSurinameSwazilandSwedenSwitzerlandSyrian Arab RepublicTajikistanTanzaniaThailandTimor-LesteTogoTongaTrinidad and TobagoTunisiaTurkeyTuvaluUgandaUkraineUnited KingdomUnited StatesUpper middle incomeUruguayVanuatuVenezuela, RBVietnamWest Bank and GazaWorldYemen, Rep.ZambiaZimbabwe Zeitlinie:
Diese Zeitleiste vorliegt die Graphik ab 1976 J. bis 2016 J. High income. Die Angaben bis 1975 J. sind nicht vorhanden. Die Zahl aktueller Beobachtungen nach Daten: 41.
Die Quelle (Bezeichnung):
Kennzahlen der Weltentwicklung
Die Quelle (Einrichtung):
International Monetary Fund, Balance of Payments Statistics Yearbook and data files.
Kategorien:
Economy & Growth, Trade
Es wurde aktualisiert:
23 Apr 2017 Jahr
Kennzahlen der Wertänderungen vom Jahr zum Jahr
im Durchschnitt:
1.375 Trln
Minimum:
168.599 Mlrd.
1 Jan 1976 Jahr
Maximum:
3.592 Trln
1 Jan 2015 Jahr
Zum Datum der Beobachtung
Wert
Absolute Veränderung
Die Veränderung bezüglich dem vorherigen Wert
1 Jan 1976 Jahr
168.599 Mlrd.
+168.599 Mlrd.
0.0%
1 Jan 1977 Jahr
191.582 Mlrd.
+22.983 Mlrd.
13.63%
1 Jan 1978 Jahr
220.183 Mlrd.
+28.6 Mlrd.
14.93%
1 Jan 1979 Jahr
264.523 Mlrd.
+44.341 Mlrd.
20.14%
1 Jan 1980 Jahr
334.012 Mlrd.
+69.489 Mlrd.
26.27%
1 Jan 1981 Jahr
397.796 Mlrd.
+63.784 Mlrd.
19.1%
1 Jan 1982 Jahr
410.726 Mlrd.
+12.931 Mlrd.
3.25%
1 Jan 1983 Jahr
402.558 Mlrd.
-8.169 Mlrd.
-1.99%
1 Jan 1984 Jahr
399.254 Mlrd.
-3.304 Mlrd.
-0.82%
1 Jan 1985 Jahr
407.024 Mlrd.
+7.771 Mlrd.
1.95%
1 Jan 1986 Jahr
413.105 Mlrd.
+6.08 Mlrd.
1.49%
1 Jan 1987 Jahr
479.153 Mlrd.
+66.048 Mlrd.
15.99%
1 Jan 1988 Jahr
563.171 Mlrd.
+84.018 Mlrd.
17.53%
1 Jan 1989 Jahr
626.586 Mlrd.
+63.415 Mlrd.
11.26%
1 Jan 1990 Jahr
675.127 Mlrd.
+48.541 Mlrd.
7.75%
1 Jan 1991 Jahr
816.223 Mlrd.
+141.096 Mlrd.
20.9%
1 Jan 1992 Jahr
865.899 Mlrd.
+49.676 Mlrd.
6.09%
1 Jan 1993 Jahr
947.483 Mlrd.
+81.584 Mlrd.
9.42%
1 Jan 1994 Jahr
916.072 Mlrd.
-31.411 Mlrd.
-3.32%
1 Jan 1995 Jahr
963.133 Mlrd.
+47.061 Mlrd.
5.14%
1 Jan 1996 Jahr
1.095 Trln
+131.997 Mlrd.
13.71%
1 Jan 1997 Jahr
1.157 Trln
+61.719 Mlrd.
5.64%
1 Jan 1998 Jahr
1.164 Trln
+7.628 Mlrd.
0.66%
1 Jan 1999 Jahr
1.191 Trln
+26.031 Mlrd.
2.24%
1 Jan 2000 Jahr
1.272 Trln
+81.267 Mlrd.
6.83%
1 Jan 2001 Jahr
1.351 Trln
+79.549 Mlrd.
6.25%
1 Jan 2002 Jahr
1.35 Trln
-1.409 Mlrd.
-0.1%
1 Jan 2003 Jahr
1.42 Trln
+70.34 Mlrd.
5.21%
1 Jan 2004 Jahr
1.613 Trln
+192.432 Mlrd.
13.55%
1 Jan 2005 Jahr
1.924 Trln
+311.026 Mlrd.
19.29%
1 Jan 2006 Jahr
2.09 Trln
+166.774 Mlrd.
8.67%
1 Jan 2007 Jahr
2.315 Trln
+224.289 Mlrd.
10.73%
1 Jan 2008 Jahr
2.692 Trln
+376.788 Mlrd.
16.28%
1 Jan 2009 Jahr
3.026 Trln
+334.239 Mlrd.
12.42%
1 Jan 2010 Jahr
2.689 Trln
-336.633 Mlrd.
-11.13%
1 Jan 2011 Jahr
2.863 Trln
+174.223 Mlrd.
6.48%
1 Jan 2012 Jahr
3.153 Trln
+289.611 Mlrd.
10.11%
1 Jan 2013 Jahr
3.204 Trln
+50.725 Mlrd.
1.61%
1 Jan 2014 Jahr
3.373 Trln
+168.864 Mlrd.
5.27%
1 Jan 2015 Jahr
3.592 Trln
+219.652 Mlrd.
6.51%
1 Jan 2016 Jahr
3.365 Trln
-227.039 Mlrd.
-6.32%
Bewertung der Länder gemäß mit laufender Statistik nach Jahren


Kommentare: