29
/de/
de
AIzaSyAYiBZKx7MnpbEhh9jyipgxe19OcubqV5w
April 1, 2024
36078
High income
HIC
false
2
1
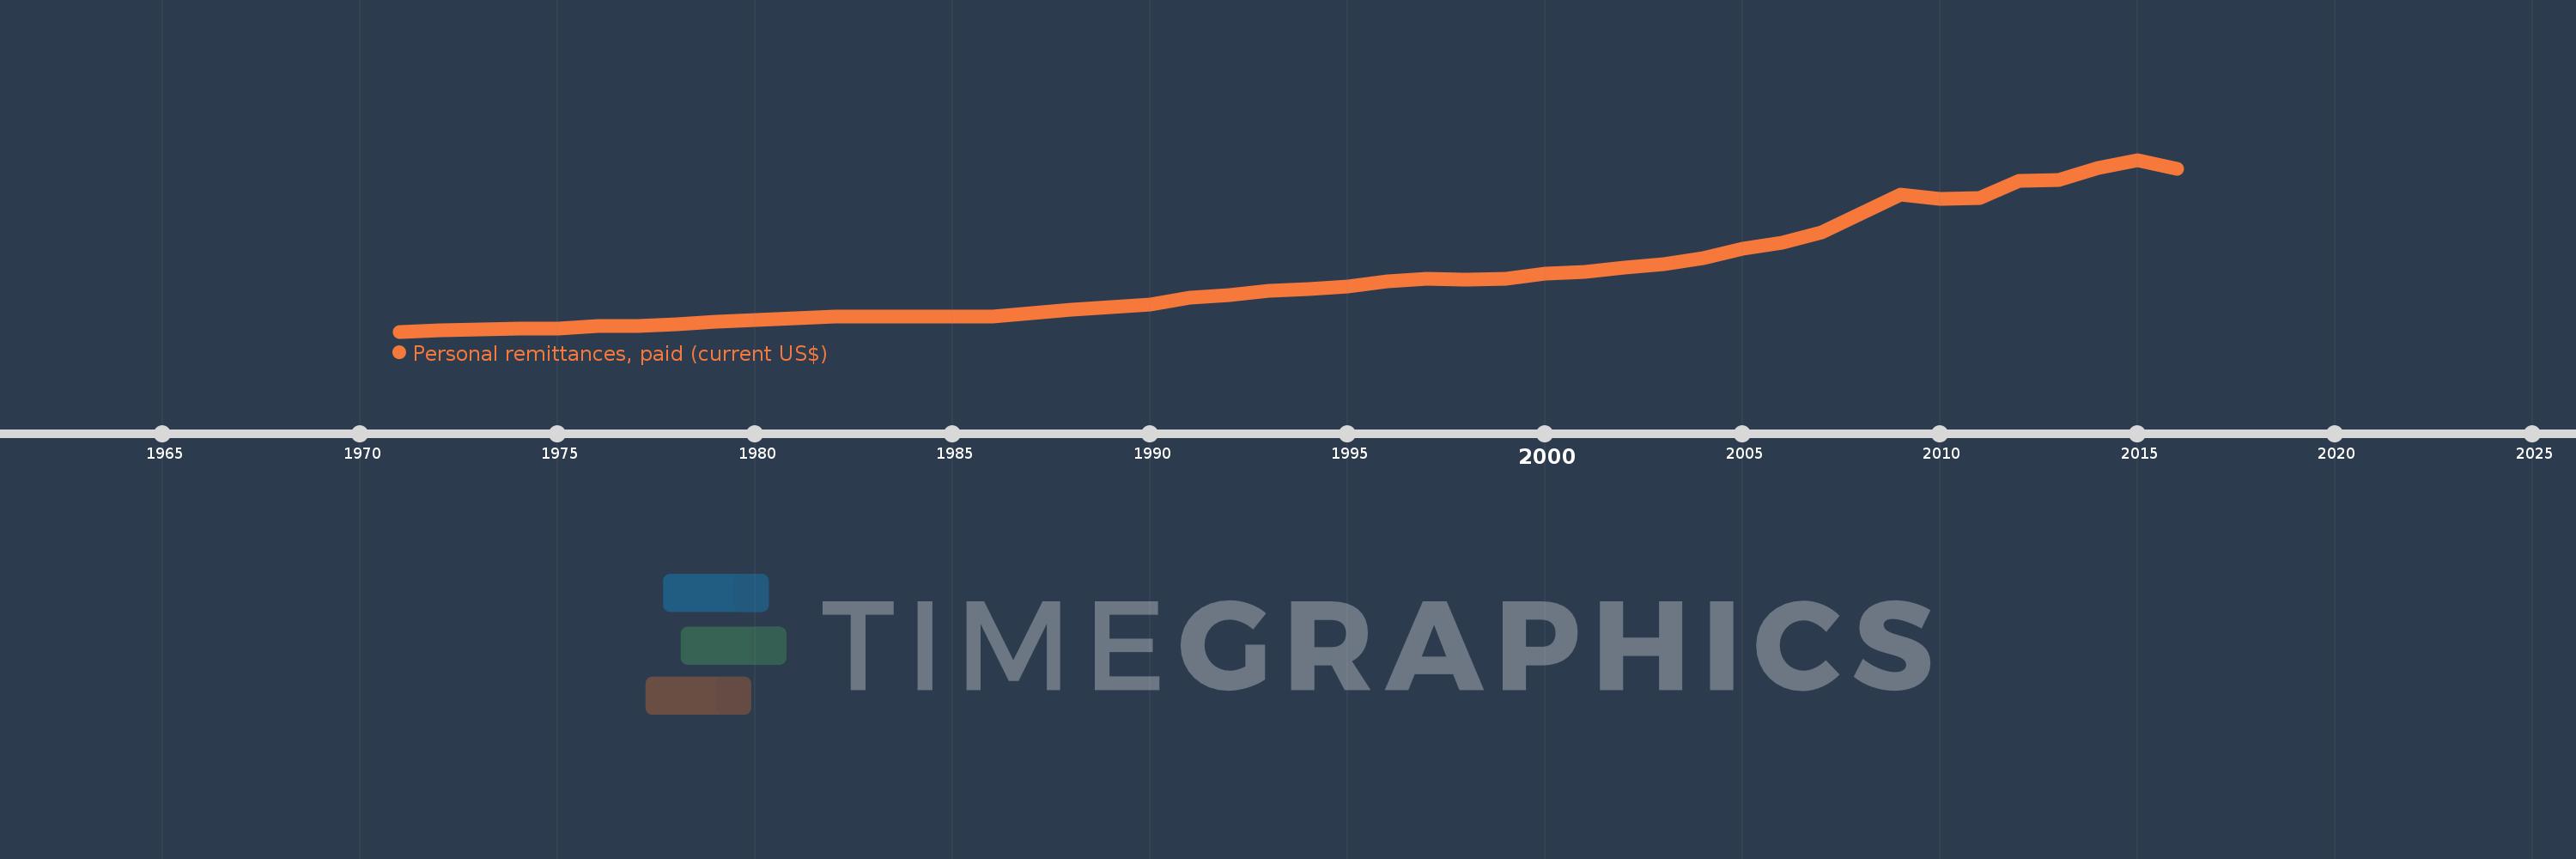
Personal remittances, paid (current US$)
2016,2015,2014,2013,2012,2011,2010,2009,2008,2007,2006,2005,2004,2003,2002,2001,2000,1999,1998,1997,1996,1995,1994,1993,1992,1991,1990,1989,1988,1987,1986,1985,1984,1983,1982,1981,1980,1979,1978,1977,1976,1975,1974,1973,1972,1971
Diese Statistik in anderen Ländern:
AfghanistanAlbaniaAlgeriaAngolaAntigua and BarbudaArab WorldArgentinaArmeniaArubaAustraliaAustriaAzerbaijanBahamas, TheBahrainBangladeshBarbadosBelarusBelgiumBelizeBeninBermudaBhutanBoliviaBosnia and HerzegovinaBotswanaBrazilBrunei DarussalamBulgariaBurkina FasoBurundiCabo VerdeCambodiaCameroonCanadaCaribbean small statesCentral African RepublicCentral Europe and the BalticsChadChileChinaColombiaComorosCongo, Dem. Rep.Congo, Rep.Costa RicaCote d'IvoireCroatiaCuracaoCyprusCzech RepublicDenmarkDjiboutiDominicaDominican RepublicEarly-demographic dividendEast Asia & PacificEast Asia & Pacific (excluding high income)East Asia & Pacific (IDA & IBRD countries)EcuadorEgypt, Arab Rep.El SalvadorEquatorial GuineaEritreaEstoniaEthiopiaEuro areaEurope & Central AsiaEurope & Central Asia (excluding high income)Europe & Central Asia (IDA & IBRD countries)European UnionFaroe IslandsFijiFinlandFragile and conflict affected situationsFranceFrench PolynesiaGabonGambia, TheGeorgiaGermanyGhanaGreeceGrenadaGuatemalaGuineaGuinea-BissauGuyanaHaitiHeavily indebted poor countries (HIPC)High incomeHondurasHong Kong SAR, ChinaHungaryIBRD onlyIcelandIDA & IBRD totalIDA blendIDA onlyIDA totalIndiaIndonesiaIraqIrelandIsraelItalyJamaicaJapanJordanKazakhstanKenyaKiribatiKorea, Rep.KosovoKuwaitKyrgyz RepublicLao PDRLate-demographic dividendLatin America & Caribbean Latin America & Caribbean (excluding high income)Latin America & the Caribbean (IDA & IBRD countries)LatviaLeast developed countries: UN classificationLebanonLesothoLiberiaLibyaLithuaniaLow & middle incomeLow incomeLower middle incomeLuxembourgMacao SAR, ChinaMacedonia, FYRMadagascarMalawiMalaysiaMaldivesMaliMaltaMarshall IslandsMauritaniaMauritiusMexicoMicronesia, Fed. Sts.Middle East & North AfricaMiddle East & North Africa (excluding high income)Middle East & North Africa (IDA & IBRD countries)Middle incomeMoldovaMongoliaMontenegroMoroccoMozambiqueMyanmarNamibiaNepalNetherlandsNew CaledoniaNew ZealandNicaraguaNigerNigeriaNorth AmericaNorwayOECD membersOmanOther small statesPacific island small statesPakistanPalauPanamaPapua New GuineaParaguayPeruPhilippinesPolandPortugalPost-demographic dividendPre-demographic dividendQatarRomaniaRussian FederationRwandaSamoaSao Tome and PrincipeSaudi ArabiaSenegalSerbiaSeychellesSierra LeoneSint Maarten (Dutch part)Slovak RepublicSloveniaSmall statesSolomon IslandsSomaliaSouth AfricaSouth AsiaSouth Asia (IDA & IBRD)South SudanSpainSri LankaSt. Kitts and NevisSt. LuciaSt. Vincent and the GrenadinesSub-Saharan Africa Sub-Saharan Africa (excluding high income)Sub-Saharan Africa (IDA & IBRD countries)SudanSurinameSwazilandSwedenSwitzerlandSyrian Arab RepublicTajikistanTanzaniaThailandTimor-LesteTogoTongaTrinidad and TobagoTunisiaTurkeyTurkmenistanTuvaluUgandaUkraineUnited KingdomUnited StatesUpper middle incomeUruguayVanuatuVenezuela, RBVietnamWest Bank and GazaWorldYemen, Rep.ZambiaZimbabwe Zeitlinie:
Diese Zeitleiste vorliegt die Graphik ab 1971 J. bis 2016 J. High income. Die Angaben bis 1970 J. sind nicht vorhanden. Die Zahl aktueller Beobachtungen nach Daten: 46.
Die Quelle (Bezeichnung):
Kennzahlen der Weltentwicklung
Die Quelle (Einrichtung):
World Bank staff estimates based on IMF balance of payments data.
Kategorien:
Economy & Growth, Financial Sector
Es wurde aktualisiert:
23 Apr 2017 Jahr
Kennzahlen der Wertänderungen vom Jahr zum Jahr
im Durchschnitt:
101.062 Mlrd.
Minimum:
1.064 Mlrd.
1 Jan 1971 Jahr
Maximum:
310.776 Mlrd.
1 Jan 2015 Jahr
Zum Datum der Beobachtung
Wert
Absolute Veränderung
Die Veränderung bezüglich dem vorherigen Wert
1 Jan 1971 Jahr
1.064 Mlrd.
+1.064 Mlrd.
0.0%
1 Jan 1972 Jahr
3.669 Mlrd.
+2.604 Mlrd.
244.71%
1 Jan 1973 Jahr
4.413 Mlrd.
+743.861 Mln.
20.28%
1 Jan 1974 Jahr
5.879 Mlrd.
+1.467 Mlrd.
33.24%
1 Jan 1975 Jahr
6.637 Mlrd.
+758.065 Mln.
12.89%
1 Jan 1976 Jahr
10.499 Mlrd.
+3.862 Mlrd.
58.19%
1 Jan 1977 Jahr
11.312 Mlrd.
+812.802 Mln.
7.74%
1 Jan 1978 Jahr
14.336 Mlrd.
+3.024 Mlrd.
26.74%
1 Jan 1979 Jahr
18.858 Mlrd.
+4.522 Mlrd.
31.54%
1 Jan 1980 Jahr
21.782 Mlrd.
+2.924 Mlrd.
15.5%
1 Jan 1981 Jahr
24.354 Mlrd.
+2.573 Mlrd.
11.81%
1 Jan 1982 Jahr
27.6 Mlrd.
+3.246 Mlrd.
13.33%
1 Jan 1983 Jahr
28.449 Mlrd.
+848.477 Mln.
3.07%
1 Jan 1984 Jahr
28.055 Mlrd.
-393.314 Mln.
-1.38%
1 Jan 1985 Jahr
27.994 Mlrd.
-61.27 Mln.
-0.22%
1 Jan 1986 Jahr
28.505 Mlrd.
+510.966 Mln.
1.83%
1 Jan 1987 Jahr
34.596 Mlrd.
+6.091 Mlrd.
21.37%
1 Jan 1988 Jahr
40.723 Mlrd.
+6.127 Mlrd.
17.71%
1 Jan 1989 Jahr
45.497 Mlrd.
+4.774 Mlrd.
11.72%
1 Jan 1990 Jahr
50.112 Mlrd.
+4.615 Mlrd.
10.14%
1 Jan 1991 Jahr
61.489 Mlrd.
+11.377 Mlrd.
22.7%
1 Jan 1992 Jahr
67.251 Mlrd.
+5.761 Mlrd.
9.37%
1 Jan 1993 Jahr
74.337 Mlrd.
+7.086 Mlrd.
10.54%
1 Jan 1994 Jahr
77.844 Mlrd.
+3.507 Mlrd.
4.72%
1 Jan 1995 Jahr
82.224 Mlrd.
+4.381 Mlrd.
5.63%
1 Jan 1996 Jahr
91.802 Mlrd.
+9.578 Mlrd.
11.65%
1 Jan 1997 Jahr
96.215 Mlrd.
+4.413 Mlrd.
4.81%
1 Jan 1998 Jahr
94.21 Mlrd.
-2.005 Mlrd.
-2.08%
1 Jan 1999 Jahr
96.175 Mlrd.
+1.965 Mlrd.
2.09%
1 Jan 2000 Jahr
105.467 Mlrd.
+9.292 Mlrd.
9.66%
1 Jan 2001 Jahr
108.218 Mlrd.
+2.751 Mlrd.
2.61%
1 Jan 2002 Jahr
115.737 Mlrd.
+7.519 Mlrd.
6.95%
1 Jan 2003 Jahr
123.329 Mlrd.
+7.592 Mlrd.
6.56%
1 Jan 2004 Jahr
134.137 Mlrd.
+10.808 Mlrd.
8.76%
1 Jan 2005 Jahr
150.343 Mlrd.
+16.206 Mlrd.
12.08%
1 Jan 2006 Jahr
161.514 Mlrd.
+11.172 Mlrd.
7.43%
1 Jan 2007 Jahr
180.364 Mlrd.
+18.85 Mlrd.
11.67%
1 Jan 2008 Jahr
214.743 Mlrd.
+34.379 Mlrd.
19.06%
1 Jan 2009 Jahr
247.504 Mlrd.
+32.761 Mlrd.
15.26%
1 Jan 2010 Jahr
240.067 Mlrd.
-7.437 Mlrd.
-3.0%
1 Jan 2011 Jahr
241.851 Mlrd.
+1.784 Mlrd.
0.74%
1 Jan 2012 Jahr
273.317 Mlrd.
+31.467 Mlrd.
13.01%
1 Jan 2013 Jahr
275.144 Mlrd.
+1.827 Mlrd.
0.67%
1 Jan 2014 Jahr
296.072 Mlrd.
+20.928 Mlrd.
7.61%
1 Jan 2015 Jahr
310.776 Mlrd.
+14.704 Mlrd.
4.97%
1 Jan 2016 Jahr
294.389 Mlrd.
-16.387 Mlrd.
-5.27%
Bewertung der Länder gemäß mit laufender Statistik nach Jahren


Kommentare: