29
/de/
de
AIzaSyAYiBZKx7MnpbEhh9jyipgxe19OcubqV5w
April 1, 2024
34629
Fragile and conflict affected situations
FCS
false
2
1
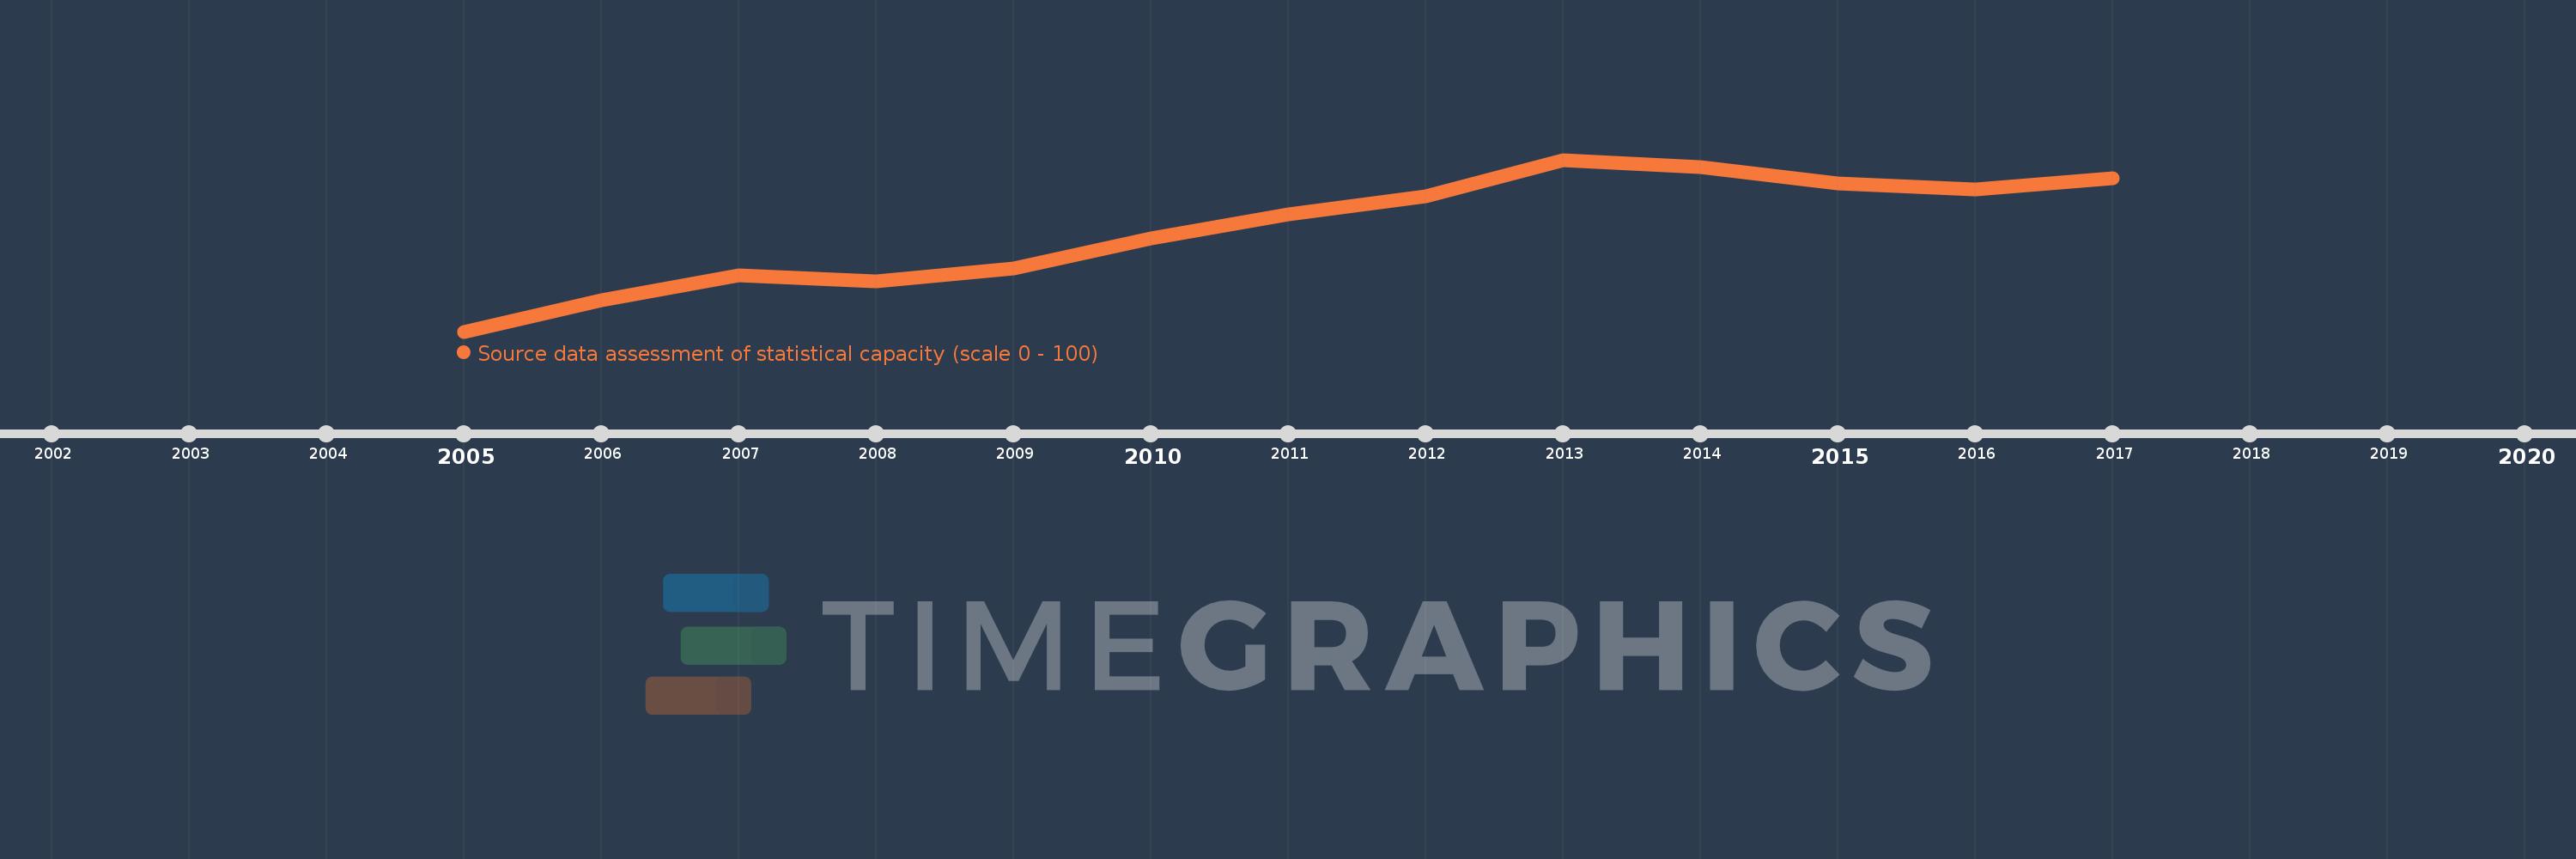
Source data assessment of statistical capacity (scale 0 - 100)
2017,2016,2015,2014,2013,2012,2011,2010,2009,2008,2007,2006,2005
Diese Statistik in anderen Ländern:
Zeitlinie:
Diese Zeitleiste vorliegt die Graphik ab 2005 J. bis 2017 J. Fragile and conflict affected situations. Die Angaben bis 2004 J. sind nicht vorhanden. Die Zahl aktueller Beobachtungen nach Daten: 13.
Die Quelle (Bezeichnung):
Kennzahlen der Weltentwicklung
Die Quelle (Einrichtung):
World Bank
Kategorien:
Public Sector
Es wurde aktualisiert:
23 Apr 2017 Jahr
Kennzahlen der Wertänderungen vom Jahr zum Jahr
Minimum:
35.2
1 Jan 2005 Jahr
Maximum:
46.154
1 Jan 2013 Jahr
Zum Datum der Beobachtung
Wert
Absolute Veränderung
Die Veränderung bezüglich dem vorherigen Wert
1 Jan 2005 Jahr
35.2
+35.2
0.0%
1 Jan 2006 Jahr
37.2
+2.0
5.68%
1 Jan 2007 Jahr
38.8
+1.6
4.3%
1 Jan 2008 Jahr
38.4
-0.4
-1.03%
1 Jan 2009 Jahr
39.2
+0.8
2.08%
1 Jan 2010 Jahr
41.154
+1.954
4.98%
1 Jan 2011 Jahr
42.692
+1.538
3.74%
1 Jan 2012 Jahr
43.846
+1.154
2.7%
1 Jan 2013 Jahr
46.154
+2.308
5.26%
1 Jan 2014 Jahr
45.714
-0.44
-0.95%
1 Jan 2015 Jahr
44.643
-1.071
-2.34%
1 Jan 2016 Jahr
44.286
-0.357
-0.8%
1 Jan 2017 Jahr
45.0
+0.714
1.61%
Bewertung der Länder gemäß mit laufender Statistik nach Jahren


Kommentare: