29
/de/
de
AIzaSyAYiBZKx7MnpbEhh9jyipgxe19OcubqV5w
April 1, 2024
34612
Fragile and conflict affected situations
FCS
false
2
1
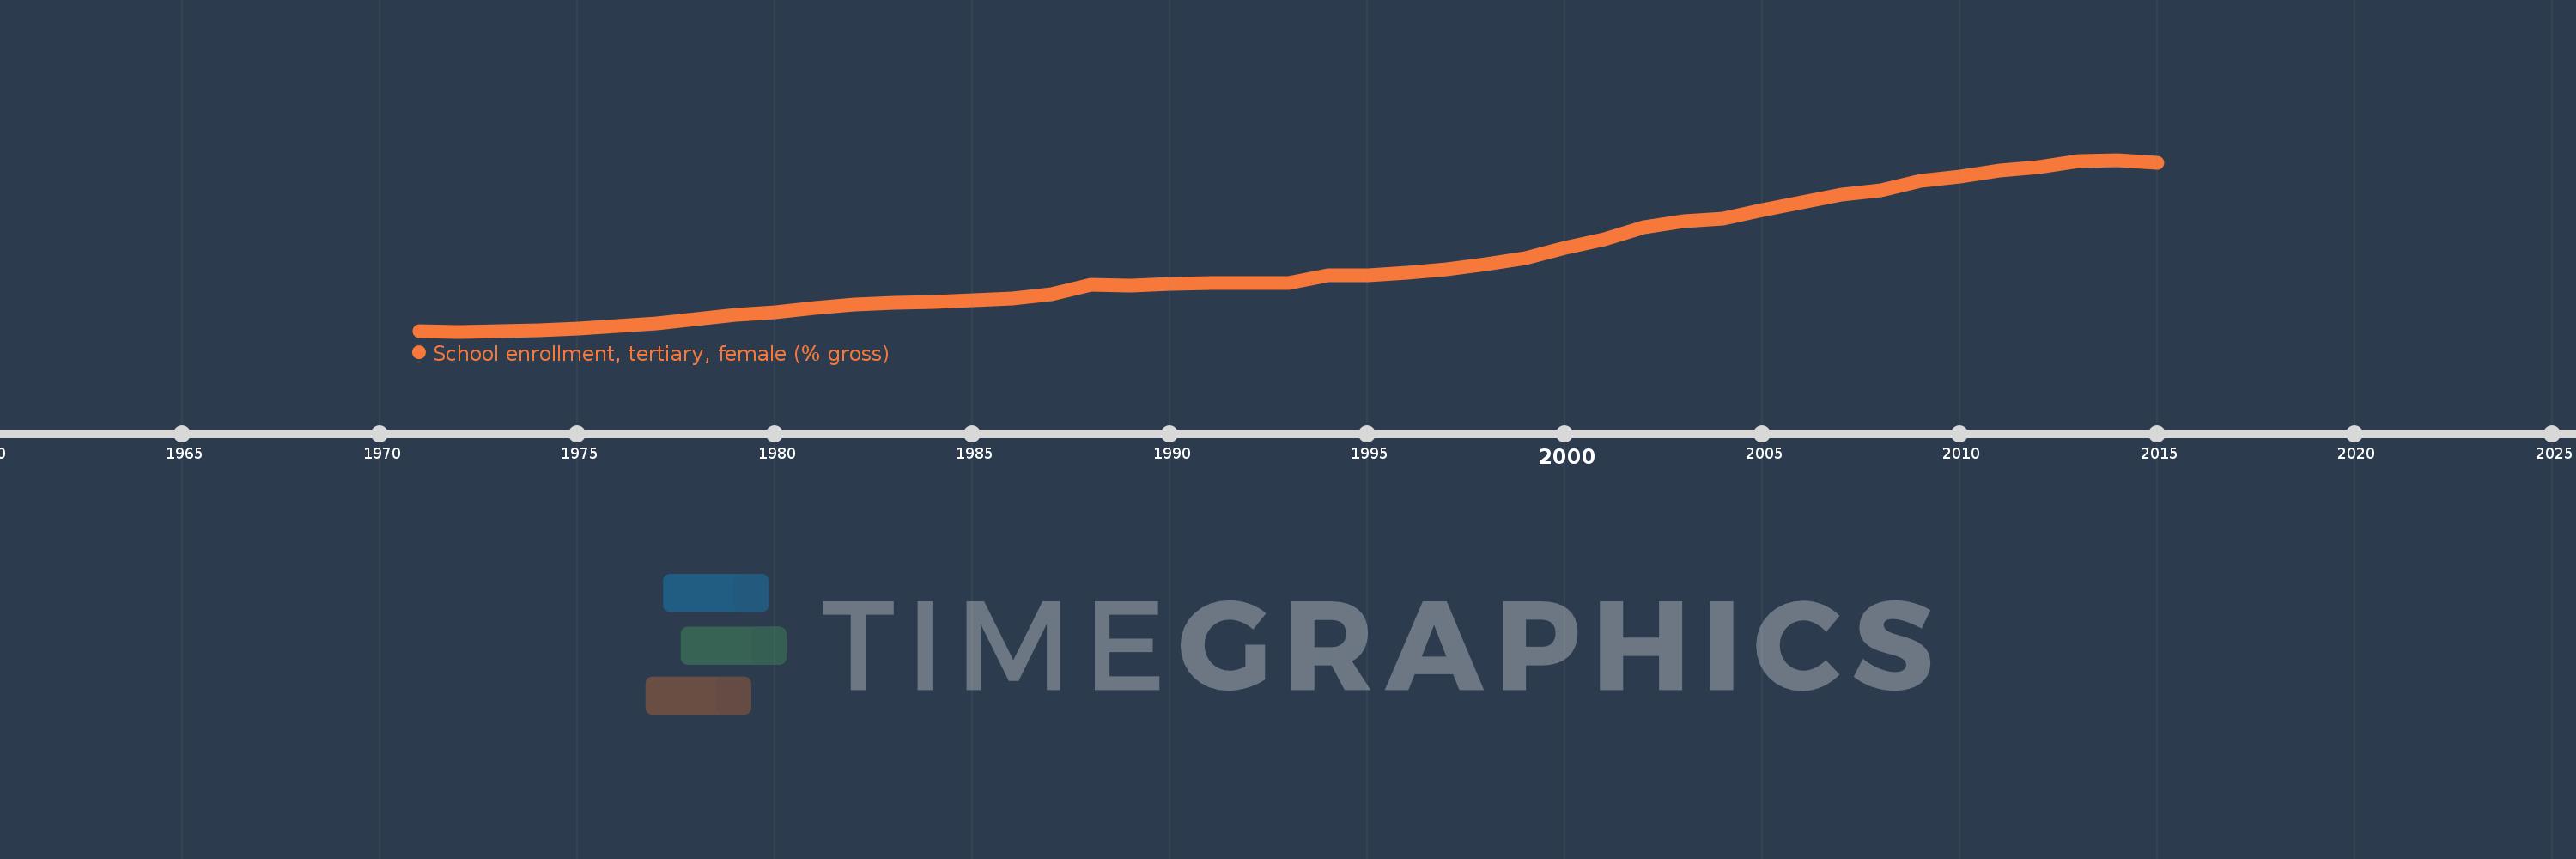
School enrollment, tertiary, female (% gross)
2015,2014,2013,2012,2011,2010,2009,2008,2007,2006,2005,2004,2003,2002,2001,2000,1999,1998,1997,1996,1995,1994,1993,1992,1991,1990,1989,1988,1987,1986,1985,1984,1983,1982,1981,1980,1979,1978,1977,1976,1975,1974,1973,1972,1971
Diese Statistik in anderen Ländern:
AfghanistanAlbaniaAlgeriaAngolaAntigua and BarbudaArab WorldArgentinaArmeniaArubaAustraliaAustriaAzerbaijanBahamas, TheBahrainBangladeshBarbadosBelarusBelgiumBelizeBeninBermudaBhutanBoliviaBosnia and HerzegovinaBotswanaBrazilBrunei DarussalamBulgariaBurkina FasoBurundiCabo VerdeCambodiaCameroonCanadaCaribbean small statesCentral African RepublicCentral Europe and the BalticsChadChileChinaColombiaComorosCongo, Dem. Rep.Congo, Rep.Costa RicaCote d'IvoireCroatiaCubaCuracaoCyprusCzech RepublicDenmarkDjiboutiDominicaDominican RepublicEarly-demographic dividendEast Asia & PacificEast Asia & Pacific (excluding high income)East Asia & Pacific (IDA & IBRD countries)EcuadorEgypt, Arab Rep.El SalvadorEquatorial GuineaEritreaEstoniaEthiopiaEuro areaEurope & Central AsiaEurope & Central Asia (excluding high income)Europe & Central Asia (IDA & IBRD countries)European UnionFijiFinlandFragile and conflict affected situationsFranceGabonGambia, TheGeorgiaGermanyGhanaGreeceGrenadaGuatemalaGuineaGuinea-BissauGuyanaHaitiHeavily indebted poor countries (HIPC)High incomeHondurasHong Kong SAR, ChinaHungaryIBRD onlyIcelandIDA & IBRD totalIDA blendIDA onlyIDA totalIndiaIndonesiaIran, Islamic Rep.IraqIrelandIsraelItalyJamaicaJapanJordanKazakhstanKenyaKorea, Dem. People’s Rep.Korea, Rep.KuwaitKyrgyz RepublicLao PDRLate-demographic dividendLatin America & Caribbean Latin America & Caribbean (excluding high income)Latin America & the Caribbean (IDA & IBRD countries)LatviaLeast developed countries: UN classificationLebanonLesothoLiberiaLibyaLiechtensteinLithuaniaLow & middle incomeLow incomeLower middle incomeLuxembourgMacao SAR, ChinaMacedonia, FYRMadagascarMalawiMaldivesMaliMaltaMarshall IslandsMauritaniaMauritiusMexicoMicronesia, Fed. Sts.Middle East & North AfricaMiddle East & North Africa (excluding high income)Middle East & North Africa (IDA & IBRD countries)Middle incomeMoldovaMongoliaMontenegroMoroccoMozambiqueMyanmarNamibiaNepalNetherlandsNew ZealandNicaraguaNigerNigeriaNorth AmericaNorwayOECD membersOmanOther small statesPacific island small statesPakistanPalauPanamaPapua New GuineaParaguayPeruPhilippinesPolandPortugalPost-demographic dividendPre-demographic dividendPuerto RicoQatarRomaniaRussian FederationRwandaSamoaSan MarinoSao Tome and PrincipeSaudi ArabiaSenegalSerbiaSeychellesSierra LeoneSingaporeSlovak RepublicSloveniaSmall statesSomaliaSouth AfricaSouth AsiaSouth Asia (IDA & IBRD)SpainSri LankaSt. Kitts and NevisSt. LuciaSt. Vincent and the GrenadinesSub-Saharan Africa Sub-Saharan Africa (excluding high income)Sub-Saharan Africa (IDA & IBRD countries)SudanSurinameSwazilandSwedenSwitzerlandSyrian Arab RepublicTajikistanTanzaniaThailandTimor-LesteTogoTongaTrinidad and TobagoTunisiaTurkeyTurkmenistanUgandaUkraineUnited Arab EmiratesUnited KingdomUnited StatesUpper middle incomeUruguayUzbekistanVanuatuVenezuela, RBVietnamWest Bank and GazaWorldYemen, Rep.ZambiaZimbabwe Zeitlinie:
Diese Zeitleiste vorliegt die Graphik ab 1971 J. bis 2015 J. Fragile and conflict affected situations. Die Angaben bis 1970 J. sind nicht vorhanden. Die Zahl aktueller Beobachtungen nach Daten: 45.
Die Quelle (Bezeichnung):
Kennzahlen der Weltentwicklung
Die Quelle (Einrichtung):
United Nations Educational, Scientific, and Cultural Organization (UNESCO) Institute for Statistics.
Kategorien:
Education, Gender
Es wurde aktualisiert:
23 Apr 2017 Jahr
Kennzahlen der Wertänderungen vom Jahr zum Jahr
Minimum:
2.015
1 Jan 1972 Jahr
Maximum:
10.053
1 Jan 2014 Jahr
Zum Datum der Beobachtung
Wert
Absolute Veränderung
Die Veränderung bezüglich dem vorherigen Wert
1 Jan 1971 Jahr
2.033
+2.033
0.0%
1 Jan 1972 Jahr
2.015
-0.018
-0.88%
1 Jan 1973 Jahr
2.041
+0.027
1.33%
1 Jan 1974 Jahr
2.063
+0.021
1.04%
1 Jan 1975 Jahr
2.142
+0.08
3.86%
1 Jan 1976 Jahr
2.271
+0.128
5.98%
1 Jan 1977 Jahr
2.403
+0.132
5.82%
1 Jan 1978 Jahr
2.614
+0.212
8.81%
1 Jan 1979 Jahr
2.794
+0.179
6.85%
1 Jan 1980 Jahr
2.938
+0.144
5.16%
1 Jan 1981 Jahr
3.108
+0.17
5.8%
1 Jan 1982 Jahr
3.293
+0.185
5.97%
1 Jan 1983 Jahr
3.37
+0.077
2.34%
1 Jan 1984 Jahr
3.399
+0.028
0.84%
1 Jan 1985 Jahr
3.484
+0.085
2.5%
1 Jan 1986 Jahr
3.563
+0.08
2.29%
1 Jan 1987 Jahr
3.764
+0.2
5.62%
1 Jan 1988 Jahr
4.204
+0.441
11.71%
1 Jan 1989 Jahr
4.184
-0.02
-0.48%
1 Jan 1990 Jahr
4.253
+0.069
1.65%
1 Jan 1991 Jahr
4.304
+0.051
1.19%
1 Jan 1992 Jahr
4.296
-0.008
-0.2%
1 Jan 1993 Jahr
4.293
-0.002
-0.05%
1 Jan 1994 Jahr
4.644
+0.351
8.17%
1 Jan 1995 Jahr
4.643
-0.001
-0.02%
1 Jan 1996 Jahr
4.748
+0.105
2.25%
1 Jan 1997 Jahr
4.941
+0.194
4.08%
1 Jan 1998 Jahr
5.183
+0.242
4.89%
1 Jan 1999 Jahr
5.463
+0.28
5.4%
1 Jan 2000 Jahr
5.939
+0.476
8.72%
1 Jan 2001 Jahr
6.325
+0.387
6.51%
1 Jan 2002 Jahr
6.91
+0.584
9.24%
1 Jan 2003 Jahr
7.184
+0.274
3.97%
1 Jan 2004 Jahr
7.318
+0.134
1.87%
1 Jan 2005 Jahr
7.701
+0.383
5.24%
1 Jan 2006 Jahr
8.046
+0.345
4.48%
1 Jan 2007 Jahr
8.437
+0.391
4.85%
1 Jan 2008 Jahr
8.631
+0.194
2.3%
1 Jan 2009 Jahr
9.062
+0.431
4.99%
1 Jan 2010 Jahr
9.278
+0.216
2.39%
1 Jan 2011 Jahr
9.557
+0.279
3.0%
1 Jan 2012 Jahr
9.695
+0.139
1.45%
1 Jan 2013 Jahr
10.003
+0.308
3.17%
1 Jan 2014 Jahr
10.053
+0.051
0.51%
1 Jan 2015 Jahr
9.928
-0.125
-1.24%
Bewertung der Länder gemäß mit laufender Statistik nach Jahren


Kommentare: