29
/de/
de
AIzaSyAYiBZKx7MnpbEhh9jyipgxe19OcubqV5w
April 1, 2024
34596
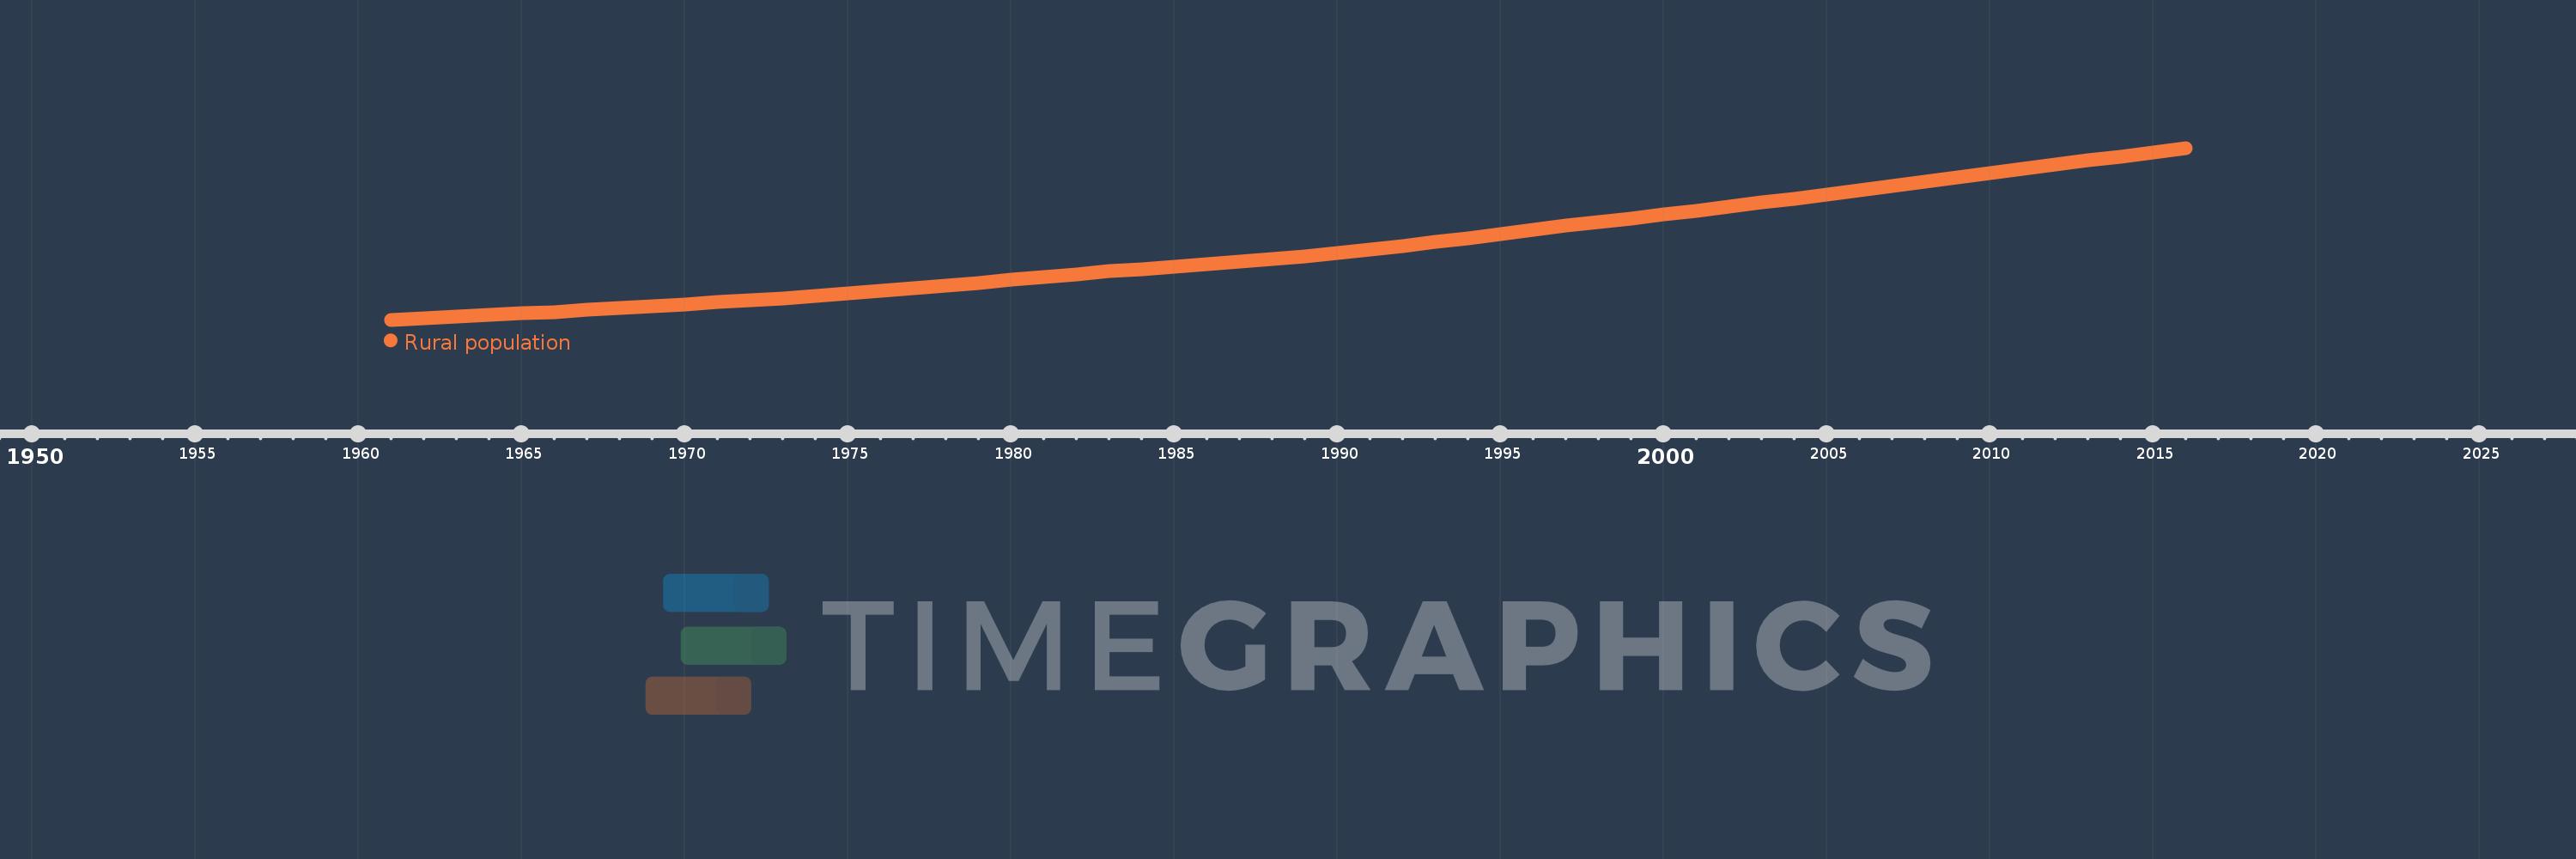
Fragile and conflict affected situations
FCS
false
2
1
Rural population
2016,2015,2014,2013,2012,2011,2010,2009,2008,2007,2006,2005,2004,2003,2002,2001,2000,1999,1998,1997,1996,1995,1994,1993,1992,1991,1990,1989,1988,1987,1986,1985,1984,1983,1982,1981,1980,1979,1978,1977,1976,1975,1974,1973,1972,1971,1970,1969,1968,1967,1966,1965,1964,1963,1962,1961
Diese Statistik in anderen Ländern:
AfghanistanAlbaniaAlgeriaAmerican SamoaAndorraAngolaAntigua and BarbudaArab WorldArgentinaArmeniaArubaAustraliaAustriaAzerbaijanBahamas, TheBahrainBangladeshBarbadosBelarusBelgiumBelizeBeninBermudaBhutanBoliviaBosnia and HerzegovinaBotswanaBrazilBritish Virgin IslandsBrunei DarussalamBulgariaBurkina FasoBurundiCabo VerdeCambodiaCameroonCanadaCaribbean small statesCayman IslandsCentral African RepublicCentral Europe and the BalticsChadChannel IslandsChileChinaColombiaComorosCongo, Dem. Rep.Congo, Rep.Costa RicaCote d'IvoireCroatiaCubaCuracaoCyprusCzech RepublicDenmarkDjiboutiDominicaDominican RepublicEarly-demographic dividendEast Asia & PacificEast Asia & Pacific (excluding high income)East Asia & Pacific (IDA & IBRD countries)EcuadorEgypt, Arab Rep.El SalvadorEquatorial GuineaEritreaEstoniaEthiopiaEuro areaEurope & Central AsiaEurope & Central Asia (excluding high income)Europe & Central Asia (IDA & IBRD countries)European UnionFaroe IslandsFijiFinlandFragile and conflict affected situationsFranceFrench PolynesiaGabonGambia, TheGeorgiaGermanyGhanaGibraltarGreeceGreenlandGrenadaGuamGuatemalaGuineaGuinea-BissauGuyanaHaitiHeavily indebted poor countries (HIPC)High incomeHondurasHong Kong SAR, ChinaHungaryIBRD onlyIcelandIDA & IBRD totalIDA blendIDA onlyIDA totalIndiaIndonesiaIran, Islamic Rep.IraqIrelandIsle of ManIsraelItalyJamaicaJapanJordanKazakhstanKenyaKiribatiKorea, Dem. People’s Rep.Korea, Rep.KuwaitKyrgyz RepublicLao PDRLate-demographic dividendLatin America & Caribbean Latin America & Caribbean (excluding high income)Latin America & the Caribbean (IDA & IBRD countries)LatviaLeast developed countries: UN classificationLebanonLesothoLiberiaLibyaLiechtensteinLithuaniaLow & middle incomeLow incomeLower middle incomeLuxembourgMacao SAR, ChinaMacedonia, FYRMadagascarMalawiMalaysiaMaldivesMaliMaltaMarshall IslandsMauritaniaMauritiusMexicoMicronesia, Fed. Sts.Middle East & North AfricaMiddle East & North Africa (excluding high income)Middle East & North Africa (IDA & IBRD countries)Middle incomeMoldovaMonacoMongoliaMontenegroMoroccoMozambiqueMyanmarNamibiaNauruNepalNetherlandsNew CaledoniaNew ZealandNicaraguaNigerNigeriaNorth AmericaNorthern Mariana IslandsNorwayOECD membersOmanOther small statesPacific island small statesPakistanPalauPanamaPapua New GuineaParaguayPeruPhilippinesPolandPortugalPost-demographic dividendPre-demographic dividendPuerto RicoQatarRomaniaRussian FederationRwandaSamoaSan MarinoSao Tome and PrincipeSaudi ArabiaSenegalSerbiaSeychellesSierra LeoneSingaporeSint Maarten (Dutch part)Slovak RepublicSloveniaSmall statesSolomon IslandsSomaliaSouth AfricaSouth AsiaSouth Asia (IDA & IBRD)South SudanSpainSri LankaSt. Kitts and NevisSt. LuciaSt. Vincent and the GrenadinesSub-Saharan Africa Sub-Saharan Africa (excluding high income)Sub-Saharan Africa (IDA & IBRD countries)SudanSurinameSwazilandSwedenSwitzerlandSyrian Arab RepublicTajikistanTanzaniaThailandTimor-LesteTogoTongaTrinidad and TobagoTunisiaTurkeyTurkmenistanTurks and Caicos IslandsTuvaluUgandaUkraineUnited Arab EmiratesUnited KingdomUnited StatesUpper middle incomeUruguayUzbekistanVanuatuVenezuela, RBVietnamVirgin Islands (U.S.)West Bank and GazaWorldYemen, Rep.ZambiaZimbabwe Zeitlinie:
Diese Zeitleiste vorliegt die Graphik ab 1961 J. bis 2016 J. Fragile and conflict affected situations. Die Angaben bis 1960 J. sind nicht vorhanden. Die Zahl aktueller Beobachtungen nach Daten: 56.
Die Quelle (Bezeichnung):
Kennzahlen der Weltentwicklung
Die Quelle (Einrichtung):
The data on urban population shares used to estimate rural population come from the United Nations, World Urbanization Prospects. Total population figures are World Bank estimates.
Kategorien:
Agriculture & Rural Development
Es wurde aktualisiert:
23 Apr 2017 Jahr
Kennzahlen der Wertänderungen vom Jahr zum Jahr
im Durchschnitt:
176.055 Mln.
Minimum:
96.927 Mln.
1 Jan 1961 Jahr
Maximum:
286.279 Mln.
1 Jan 2016 Jahr
Zum Datum der Beobachtung
Wert
Absolute Veränderung
Die Veränderung bezüglich dem vorherigen Wert
1 Jan 1961 Jahr
96.927 Mln.
+96.927 Mln.
0.0%
1 Jan 1962 Jahr
98.569 Mln.
+1.643 Mln.
1.69%
1 Jan 1963 Jahr
100.247 Mln.
+1.677 Mln.
1.7%
1 Jan 1964 Jahr
101.966 Mln.
+1.72 Mln.
1.72%
1 Jan 1965 Jahr
103.751 Mln.
+1.784 Mln.
1.75%
1 Jan 1966 Jahr
105.581 Mln.
+1.831 Mln.
1.76%
1 Jan 1967 Jahr
107.556 Mln.
+1.975 Mln.
1.87%
1 Jan 1968 Jahr
109.621 Mln.
+2.064 Mln.
1.92%
1 Jan 1969 Jahr
111.745 Mln.
+2.124 Mln.
1.94%
1 Jan 1970 Jahr
113.902 Mln.
+2.157 Mln.
1.93%
1 Jan 1971 Jahr
116.079 Mln.
+2.178 Mln.
1.91%
1 Jan 1972 Jahr
118.296 Mln.
+2.217 Mln.
1.91%
1 Jan 1973 Jahr
120.569 Mln.
+2.273 Mln.
1.92%
1 Jan 1974 Jahr
122.941 Mln.
+2.372 Mln.
1.97%
1 Jan 1975 Jahr
125.593 Mln.
+2.652 Mln.
2.16%
1 Jan 1976 Jahr
128.407 Mln.
+2.815 Mln.
2.24%
1 Jan 1977 Jahr
131.388 Mln.
+2.981 Mln.
2.32%
1 Jan 1978 Jahr
134.517 Mln.
+3.128 Mln.
2.38%
1 Jan 1979 Jahr
137.725 Mln.
+3.209 Mln.
2.39%
1 Jan 1980 Jahr
141.018 Mln.
+3.292 Mln.
2.39%
1 Jan 1981 Jahr
144.208 Mln.
+3.191 Mln.
2.26%
1 Jan 1982 Jahr
147.252 Mln.
+3.043 Mln.
2.11%
1 Jan 1983 Jahr
150.191 Mln.
+2.939 Mln.
2.0%
1 Jan 1984 Jahr
152.964 Mln.
+2.773 Mln.
1.85%
1 Jan 1985 Jahr
155.632 Mln.
+2.668 Mln.
1.74%
1 Jan 1986 Jahr
158.347 Mln.
+2.715 Mln.
1.74%
1 Jan 1987 Jahr
161.128 Mln.
+2.781 Mln.
1.76%
1 Jan 1988 Jahr
163.968 Mln.
+2.84 Mln.
1.76%
1 Jan 1989 Jahr
167.022 Mln.
+3.053 Mln.
1.86%
1 Jan 1990 Jahr
170.316 Mln.
+3.295 Mln.
1.97%
1 Jan 1991 Jahr
174.481 Mln.
+4.165 Mln.
2.45%
1 Jan 1992 Jahr
178.309 Mln.
+3.828 Mln.
2.19%
1 Jan 1993 Jahr
182.481 Mln.
+4.172 Mln.
2.34%
1 Jan 1994 Jahr
186.909 Mln.
+4.428 Mln.
2.43%
1 Jan 1995 Jahr
191.603 Mln.
+4.694 Mln.
2.51%
1 Jan 1996 Jahr
196.152 Mln.
+4.549 Mln.
2.37%
1 Jan 1997 Jahr
200.524 Mln.
+4.372 Mln.
2.23%
1 Jan 1998 Jahr
204.691 Mln.
+4.167 Mln.
2.08%
1 Jan 1999 Jahr
208.755 Mln.
+4.064 Mln.
1.99%
1 Jan 2000 Jahr
212.848 Mln.
+4.094 Mln.
1.96%
1 Jan 2001 Jahr
217.094 Mln.
+4.245 Mln.
1.99%
1 Jan 2002 Jahr
221.436 Mln.
+4.342 Mln.
2.0%
1 Jan 2003 Jahr
225.926 Mln.
+4.49 Mln.
2.03%
1 Jan 2004 Jahr
230.592 Mln.
+4.667 Mln.
2.07%
1 Jan 2005 Jahr
235.317 Mln.
+4.725 Mln.
2.05%
1 Jan 2006 Jahr
239.989 Mln.
+4.672 Mln.
1.99%
1 Jan 2007 Jahr
244.655 Mln.
+4.666 Mln.
1.94%
1 Jan 2008 Jahr
249.307 Mln.
+4.652 Mln.
1.9%
1 Jan 2009 Jahr
253.955 Mln.
+4.647 Mln.
1.86%
1 Jan 2010 Jahr
258.583 Mln.
+4.629 Mln.
1.82%
1 Jan 2011 Jahr
263.194 Mln.
+4.611 Mln.
1.78%
1 Jan 2012 Jahr
267.776 Mln.
+4.582 Mln.
1.74%
1 Jan 2013 Jahr
272.338 Mln.
+4.561 Mln.
1.7%
1 Jan 2014 Jahr
276.915 Mln.
+4.578 Mln.
1.68%
1 Jan 2015 Jahr
281.552 Mln.
+4.637 Mln.
1.67%
1 Jan 2016 Jahr
286.279 Mln.
+4.727 Mln.
1.68%
Bewertung der Länder gemäß mit laufender Statistik nach Jahren


Kommentare: