Download Diese Statistik in anderen Ländern:
Zeitlinie:
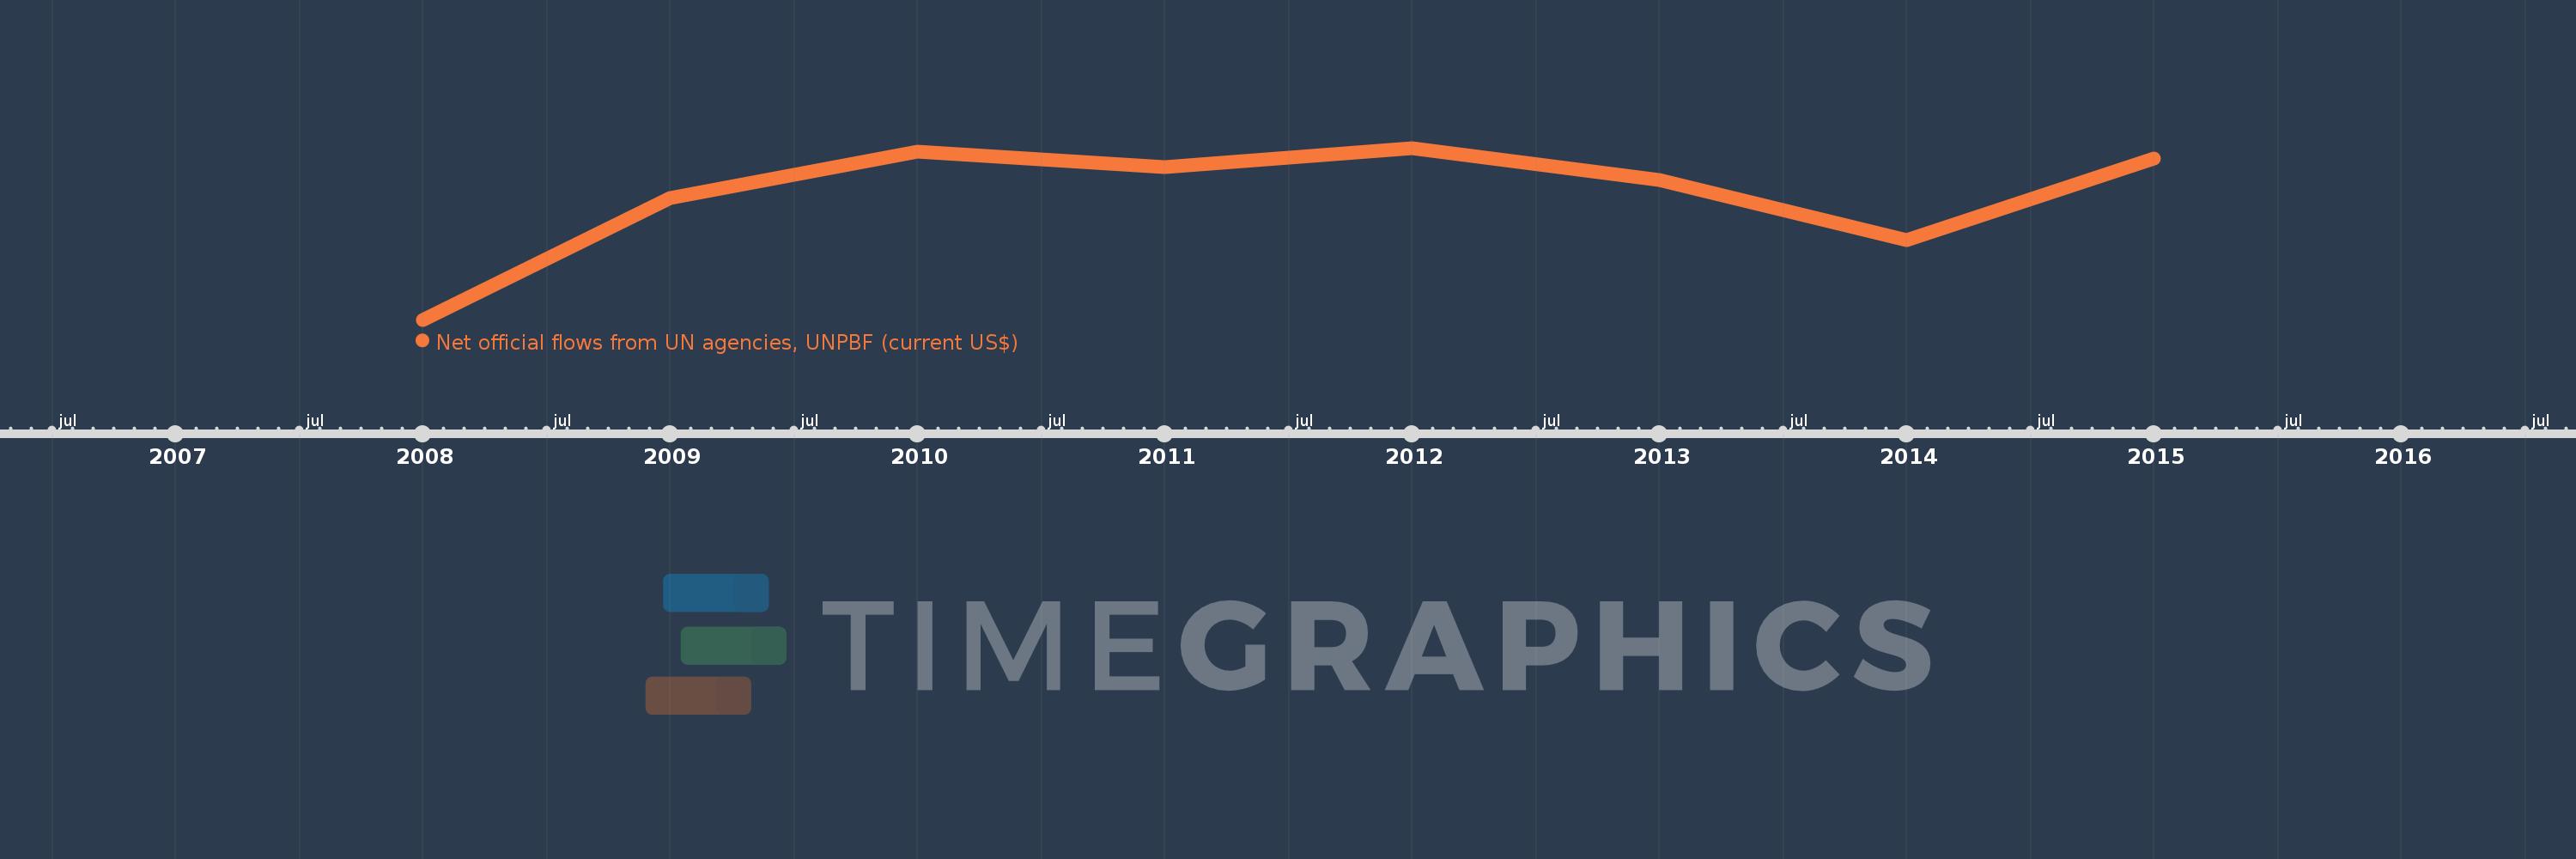
Diese Zeitleiste vorliegt die Graphik ab 2008 J. bis 2015 J. Fragile and conflict affected situations. Die Angaben bis 2007 J. sind nicht vorhanden. Die Zahl aktueller Beobachtungen nach Daten: 8.
Die Quelle (Bezeichnung):
Kennzahlen der Weltentwicklung
Die Quelle (Einrichtung):
Development Assistance Committee of the Organisation for Economic Co-operation and Development, Geographical Distribution of Financial Flows to Developing Countries, Development Co-operation Report, and International Development Statistics database. Data are available online at: www.oecd.org/dac/stats/idsonline.
Kategorien:
Aid Effectiveness
Es wurde aktualisiert:
23 Apr 2017 Jahr
Kennzahlen der Wertänderungen vom Jahr zum Jahr
im Durchschnitt:
32.956 Mln.
Minimum:
9.55 Mln.
1 Jan 2008 Jahr
Maximum:
41.91 Mln.
1 Jan 2012 Jahr
Zum Datum der Beobachtung
Wert
Absolute Veränderung
Die Veränderung bezüglich dem vorherigen Wert
1 Jan 2008 Jahr
9.55 Mln.
+9.55 Mln.
0.0%
1 Jan 2009 Jahr
32.49 Mln.
+22.94 Mln.
240.21%
1 Jan 2010 Jahr
41.14 Mln.
+8.65 Mln.
26.62%
1 Jan 2011 Jahr
38.25 Mln.
-2.89 Mln.
-7.02%
1 Jan 2012 Jahr
41.91 Mln.
+3.66 Mln.
9.57%
1 Jan 2013 Jahr
35.94 Mln.
-5.97 Mln.
-14.24%
1 Jan 2014 Jahr
24.49 Mln.
-11.45 Mln.
-31.86%
1 Jan 2015 Jahr
39.88 Mln.
+15.39 Mln.
62.84%
Bewertung der Länder gemäß mit laufender Statistik nach Jahren
