29
/de/
de
AIzaSyAYiBZKx7MnpbEhh9jyipgxe19OcubqV5w
April 1, 2024
34413
Fragile and conflict affected situations
FCS
false
2
1
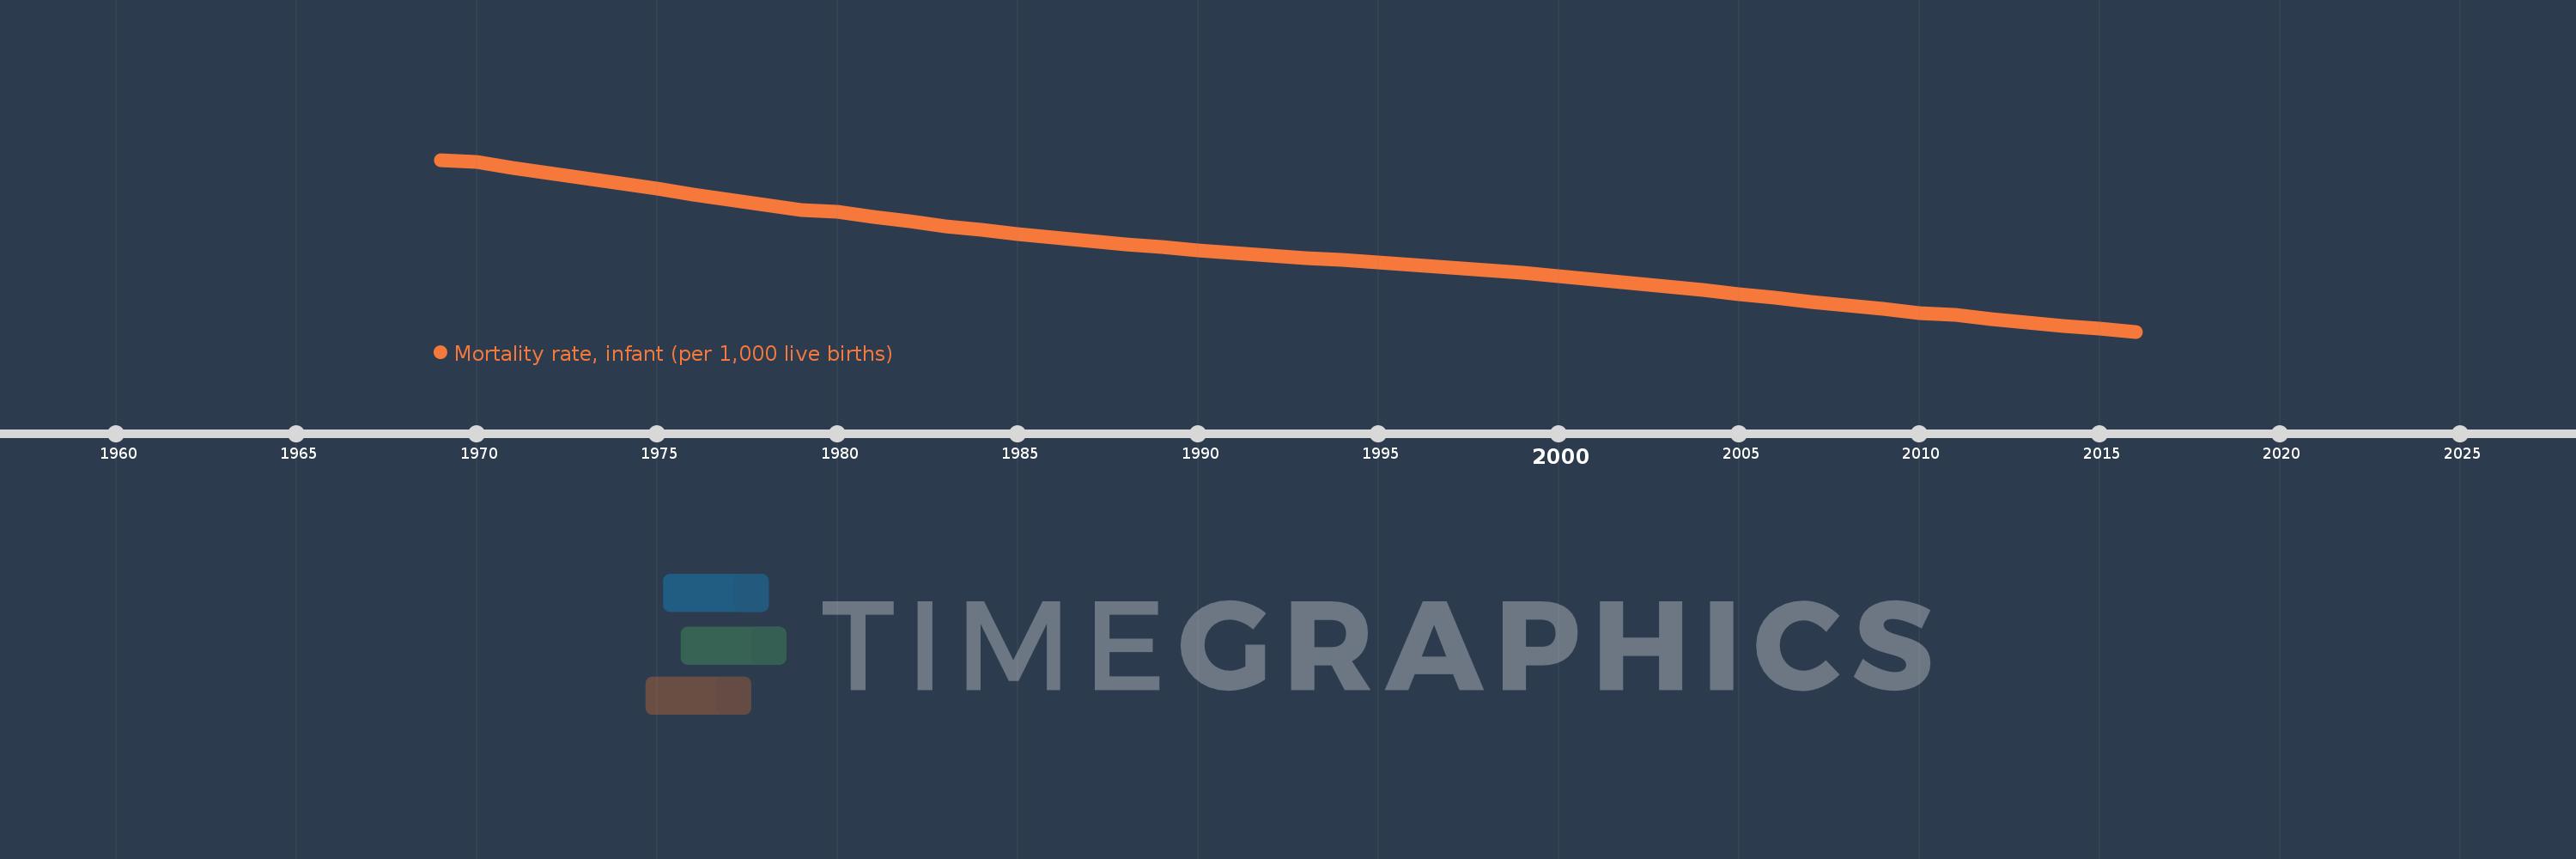
Mortality rate, infant (per 1,000 live births)
2016,2015,2014,2013,2012,2011,2010,2009,2008,2007,2006,2005,2004,2003,2002,2001,2000,1999,1998,1997,1996,1995,1994,1993,1992,1991,1990,1989,1988,1987,1986,1985,1984,1983,1982,1981,1980,1979,1978,1977,1976,1975,1974,1973,1972,1971,1970,1969
Diese Statistik in anderen Ländern:
AfghanistanAlbaniaAlgeriaAndorraAngolaAntigua and BarbudaArab WorldArgentinaArmeniaAustraliaAustriaAzerbaijanBahamas, TheBahrainBangladeshBarbadosBelarusBelgiumBelizeBeninBhutanBoliviaBosnia and HerzegovinaBotswanaBrazilBrunei DarussalamBulgariaBurkina FasoBurundiCabo VerdeCambodiaCameroonCanadaCaribbean small statesCentral African RepublicCentral Europe and the BalticsChadChileChinaColombiaComorosCongo, Dem. Rep.Congo, Rep.Costa RicaCote d'IvoireCroatiaCubaCyprusCzech RepublicDenmarkDjiboutiDominicaDominican RepublicEarly-demographic dividendEast Asia & PacificEast Asia & Pacific (excluding high income)East Asia & Pacific (IDA & IBRD countries)EcuadorEgypt, Arab Rep.El SalvadorEquatorial GuineaEritreaEstoniaEthiopiaEuro areaEurope & Central AsiaEurope & Central Asia (excluding high income)Europe & Central Asia (IDA & IBRD countries)European UnionFijiFinlandFragile and conflict affected situationsFranceGabonGambia, TheGeorgiaGermanyGhanaGreeceGrenadaGuatemalaGuineaGuinea-BissauGuyanaHaitiHeavily indebted poor countries (HIPC)High incomeHondurasHungaryIBRD onlyIcelandIDA & IBRD totalIDA blendIDA onlyIDA totalIndiaIndonesiaIran, Islamic Rep.IraqIrelandIsraelItalyJamaicaJapanJordanKazakhstanKenyaKiribatiKorea, Dem. People’s Rep.Korea, Rep.KuwaitKyrgyz RepublicLao PDRLate-demographic dividendLatin America & Caribbean Latin America & Caribbean (excluding high income)Latin America & the Caribbean (IDA & IBRD countries)LatviaLeast developed countries: UN classificationLebanonLesothoLiberiaLibyaLithuaniaLow & middle incomeLow incomeLower middle incomeLuxembourgMacedonia, FYRMadagascarMalawiMalaysiaMaldivesMaliMaltaMarshall IslandsMauritaniaMauritiusMexicoMicronesia, Fed. Sts.Middle East & North AfricaMiddle East & North Africa (excluding high income)Middle East & North Africa (IDA & IBRD countries)Middle incomeMoldovaMonacoMongoliaMontenegroMoroccoMozambiqueMyanmarNamibiaNauruNepalNetherlandsNew ZealandNicaraguaNigerNigeriaNorth AmericaNorwayOECD membersOmanOther small statesPacific island small statesPakistanPalauPanamaPapua New GuineaParaguayPeruPhilippinesPolandPortugalPost-demographic dividendPre-demographic dividendQatarRomaniaRussian FederationRwandaSamoaSan MarinoSao Tome and PrincipeSaudi ArabiaSenegalSerbiaSeychellesSierra LeoneSingaporeSlovak RepublicSloveniaSmall statesSolomon IslandsSomaliaSouth AfricaSouth AsiaSouth Asia (IDA & IBRD)South SudanSpainSri LankaSt. Kitts and NevisSt. LuciaSt. Vincent and the GrenadinesSub-Saharan Africa Sub-Saharan Africa (excluding high income)Sub-Saharan Africa (IDA & IBRD countries)SudanSurinameSwazilandSwedenSwitzerlandSyrian Arab RepublicTajikistanTanzaniaThailandTimor-LesteTogoTongaTrinidad and TobagoTunisiaTurkeyTurkmenistanTuvaluUgandaUkraineUnited Arab EmiratesUnited KingdomUnited StatesUpper middle incomeUruguayUzbekistanVanuatuVenezuela, RBVietnamWest Bank and GazaWorldYemen, Rep.ZambiaZimbabwe Zeitlinie:
Diese Zeitleiste vorliegt die Graphik ab 1969 J. bis 2016 J. Fragile and conflict affected situations. Die Angaben bis 1968 J. sind nicht vorhanden. Die Zahl aktueller Beobachtungen nach Daten: 48.
Die Quelle (Bezeichnung):
Kennzahlen der Weltentwicklung
Die Quelle (Einrichtung):
Estimates Developed by the UN Inter-agency Group for Child Mortality Estimation (UNICEF, WHO, World Bank, UN DESA Population Division) at www.childmortality.org. Projected data are from the United Nations Population Division's World Population Prospects; and may in some cases not be consistent with data before the current year.
Kategorien:
Health
Es wurde aktualisiert:
23 Apr 2017 Jahr
Kennzahlen der Wertänderungen vom Jahr zum Jahr
Minimum:
55.385
1 Jan 2016 Jahr
Maximum:
139.669
1 Jan 1969 Jahr
Zum Datum der Beobachtung
Wert
Absolute Veränderung
Die Veränderung bezüglich dem vorherigen Wert
1 Jan 1969 Jahr
139.669
+139.669
0.0%
1 Jan 1970 Jahr
138.626
-1.042
-0.75%
1 Jan 1971 Jahr
135.841
-2.785
-2.01%
1 Jan 1972 Jahr
133.125
-2.716
-2.0%
1 Jan 1973 Jahr
130.501
-2.624
-1.97%
1 Jan 1974 Jahr
127.94
-2.56
-1.96%
1 Jan 1975 Jahr
125.419
-2.521
-1.97%
1 Jan 1976 Jahr
122.507
-2.912
-2.32%
1 Jan 1977 Jahr
119.991
-2.515
-2.05%
1 Jan 1978 Jahr
117.428
-2.564
-2.14%
1 Jan 1979 Jahr
114.882
-2.546
-2.17%
1 Jan 1980 Jahr
114.113
-0.768
-0.67%
1 Jan 1981 Jahr
111.698
-2.415
-2.12%
1 Jan 1982 Jahr
109.383
-2.315
-2.07%
1 Jan 1983 Jahr
107.126
-2.257
-2.06%
1 Jan 1984 Jahr
105.247
-1.879
-1.75%
1 Jan 1985 Jahr
103.206
-2.041
-1.94%
1 Jan 1986 Jahr
101.373
-1.833
-1.78%
1 Jan 1987 Jahr
99.872
-1.501
-1.48%
1 Jan 1988 Jahr
98.281
-1.59
-1.59%
1 Jan 1989 Jahr
96.799
-1.483
-1.51%
1 Jan 1990 Jahr
95.409
-1.39
-1.44%
1 Jan 1991 Jahr
94.108
-1.301
-1.36%
1 Jan 1992 Jahr
92.808
-1.3
-1.38%
1 Jan 1993 Jahr
91.591
-1.218
-1.31%
1 Jan 1994 Jahr
90.453
-1.137
-1.24%
1 Jan 1995 Jahr
89.282
-1.171
-1.29%
1 Jan 1996 Jahr
88.153
-1.129
-1.26%
1 Jan 1997 Jahr
86.957
-1.196
-1.36%
1 Jan 1998 Jahr
85.658
-1.299
-1.49%
1 Jan 1999 Jahr
84.216
-1.442
-1.68%
1 Jan 2000 Jahr
82.699
-1.517
-1.8%
1 Jan 2001 Jahr
81.036
-1.663
-2.01%
1 Jan 2002 Jahr
79.287
-1.749
-2.16%
1 Jan 2003 Jahr
77.463
-1.824
-2.3%
1 Jan 2004 Jahr
75.621
-1.842
-2.38%
1 Jan 2005 Jahr
73.769
-1.853
-2.45%
1 Jan 2006 Jahr
71.891
-1.878
-2.55%
1 Jan 2007 Jahr
70.036
-1.855
-2.58%
1 Jan 2008 Jahr
68.199
-1.837
-2.62%
1 Jan 2009 Jahr
66.735
-1.464
-2.15%
1 Jan 2010 Jahr
64.65
-2.085
-3.12%
1 Jan 2011 Jahr
63.454
-1.196
-1.85%
1 Jan 2012 Jahr
61.37
-2.084
-3.28%
1 Jan 2013 Jahr
59.721
-1.649
-2.69%
1 Jan 2014 Jahr
58.2
-1.521
-2.55%
1 Jan 2015 Jahr
56.776
-1.424
-2.45%
1 Jan 2016 Jahr
55.385
-1.391
-2.45%
Bewertung der Länder gemäß mit laufender Statistik nach Jahren


Kommentare: