29
/de/
de
AIzaSyAYiBZKx7MnpbEhh9jyipgxe19OcubqV5w
April 1, 2024
34390
Fragile and conflict affected situations
FCS
false
2
1
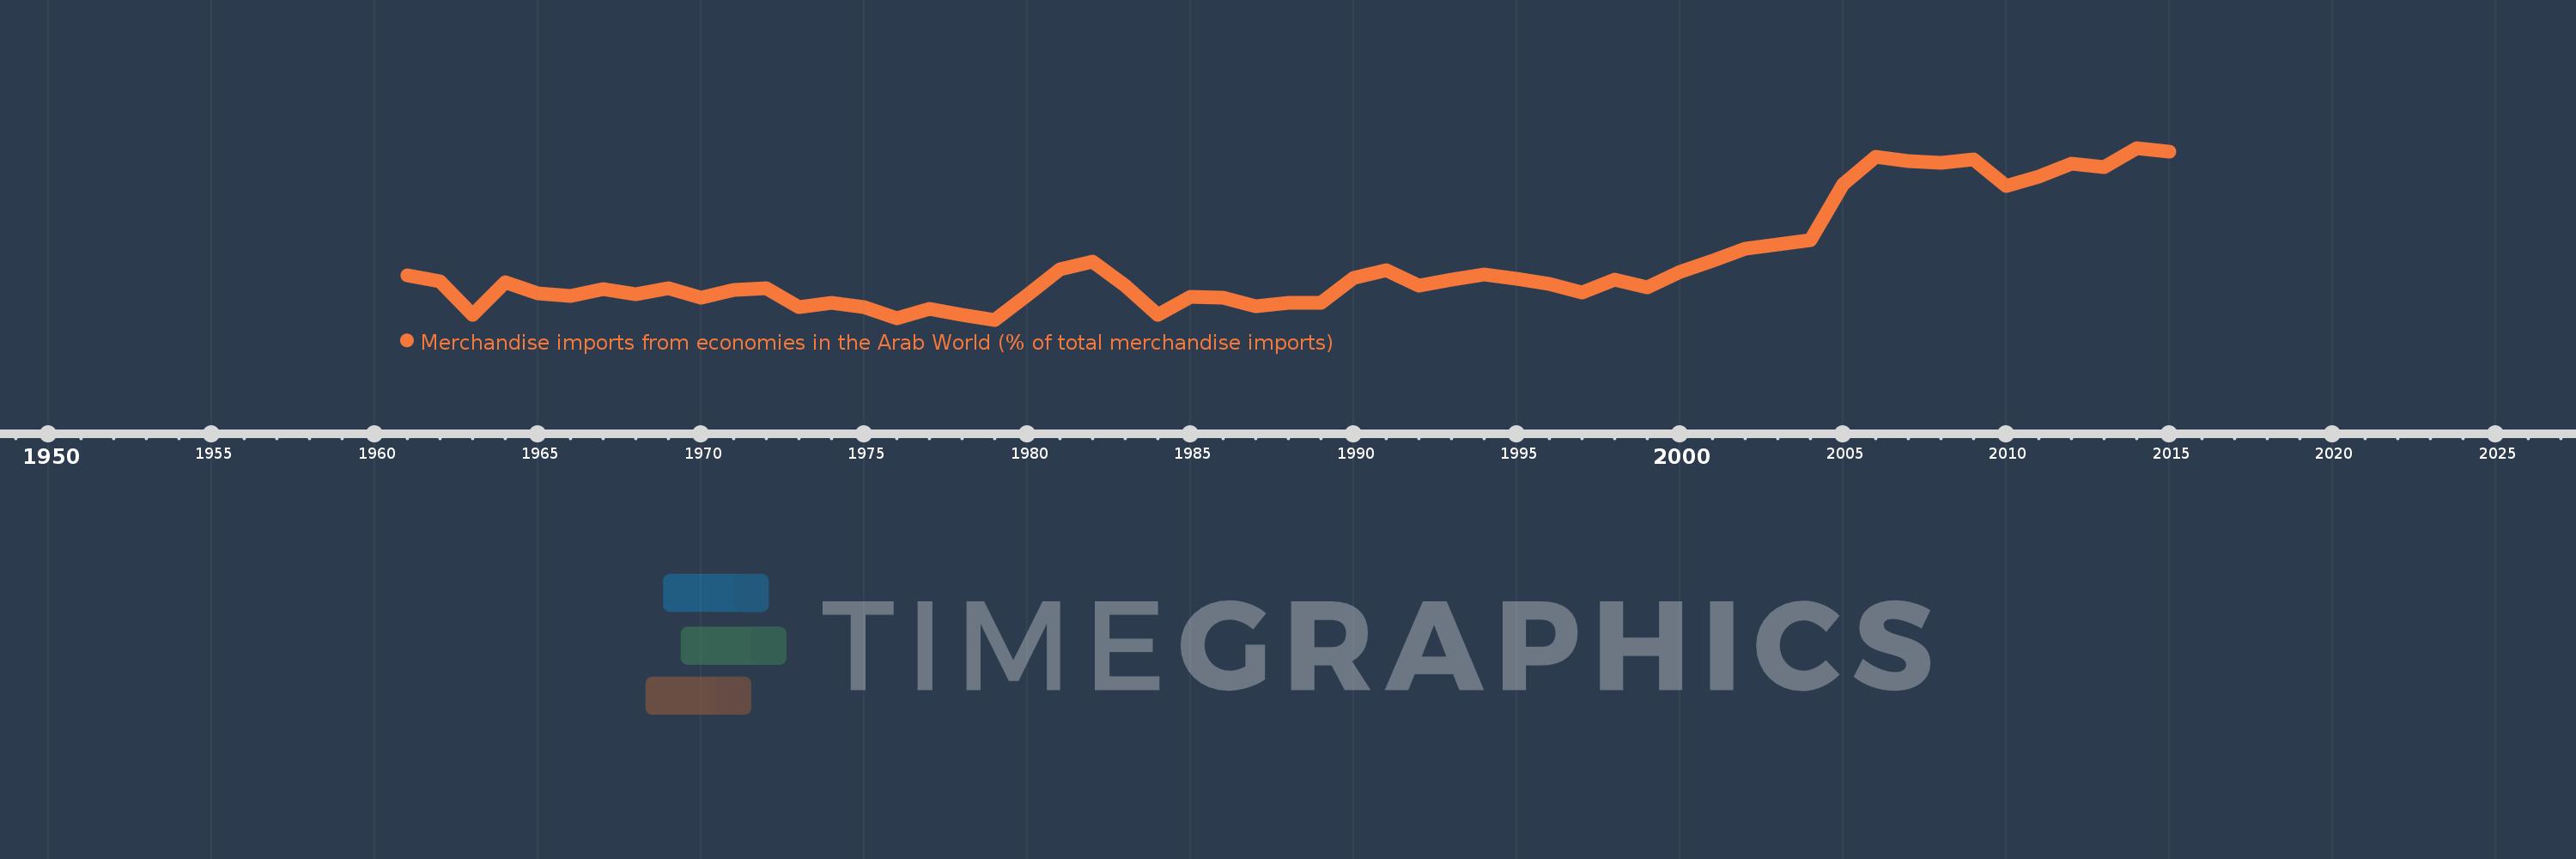
Merchandise imports from economies in the Arab World (% of total merchandise imports)
2015,2014,2013,2012,2011,2010,2009,2008,2007,2006,2005,2004,2003,2002,2001,2000,1999,1998,1997,1996,1995,1994,1993,1992,1991,1990,1989,1988,1987,1986,1985,1984,1983,1982,1981,1980,1979,1978,1977,1976,1975,1974,1973,1972,1971,1970,1969,1968,1967,1966,1965,1964,1963,1962,1961
Diese Statistik in anderen Ländern:
AfghanistanAlbaniaAlgeriaAngolaArab WorldArgentinaArmeniaArubaAustraliaAustriaAzerbaijanBahamas, TheBahrainBangladeshBarbadosBelarusBelgiumBelizeBeninBermudaBoliviaBrazilBrunei DarussalamBulgariaBurkina FasoBurundiCabo VerdeCambodiaCameroonCanadaCaribbean small statesCentral African RepublicCentral Europe and the BalticsChadChileChinaColombiaComorosCongo, Dem. Rep.Congo, Rep.Costa RicaCote d'IvoireCroatiaCubaCyprusCzech RepublicDenmarkDjiboutiDominicaDominican RepublicEarly-demographic dividendEast Asia & PacificEast Asia & Pacific (excluding high income)East Asia & Pacific (IDA & IBRD countries)EcuadorEgypt, Arab Rep.El SalvadorEstoniaEthiopiaEuro areaEurope & Central AsiaEurope & Central Asia (excluding high income)Europe & Central Asia (IDA & IBRD countries)European UnionFijiFinlandFragile and conflict affected situationsFranceFrench PolynesiaGabonGambia, TheGeorgiaGermanyGhanaGreeceGreenlandGrenadaGuatemalaGuineaGuinea-BissauGuyanaHaitiHeavily indebted poor countries (HIPC)High incomeHondurasHong Kong SAR, ChinaHungaryIBRD onlyIcelandIDA & IBRD totalIDA blendIDA onlyIDA totalIndiaIndonesiaIran, Islamic Rep.IraqIrelandItalyJamaicaJapanJordanKazakhstanKenyaKorea, Dem. People’s Rep.Korea, Rep.KuwaitKyrgyz RepublicLao PDRLate-demographic dividendLatin America & Caribbean Latin America & Caribbean (excluding high income)Latin America & the Caribbean (IDA & IBRD countries)LatviaLeast developed countries: UN classificationLebanonLiberiaLibyaLithuaniaLow & middle incomeLow incomeLower middle incomeLuxembourgMacao SAR, ChinaMacedonia, FYRMadagascarMalawiMalaysiaMaldivesMaliMaltaMauritaniaMauritiusMexicoMiddle East & North AfricaMiddle East & North Africa (excluding high income)Middle East & North Africa (IDA & IBRD countries)Middle incomeMoldovaMongoliaMontenegroMoroccoMozambiqueMyanmarNepalNetherlandsNew CaledoniaNew ZealandNicaraguaNigerNigeriaNorth AmericaNorwayOECD membersOmanOther small statesPacific island small statesPakistanPanamaPapua New GuineaParaguayPeruPhilippinesPolandPortugalPost-demographic dividendPre-demographic dividendQatarRomaniaRussian FederationRwandaSaudi ArabiaSenegalSerbiaSeychellesSierra LeoneSingaporeSlovak RepublicSloveniaSmall statesSomaliaSouth AfricaSouth AsiaSouth Asia (IDA & IBRD)SpainSri LankaSt. LuciaSt. Vincent and the GrenadinesSub-Saharan Africa Sub-Saharan Africa (excluding high income)Sub-Saharan Africa (IDA & IBRD countries)SudanSurinameSwedenSwitzerlandSyrian Arab RepublicTajikistanTanzaniaThailandTogoTrinidad and TobagoTunisiaTurkeyTurkmenistanUgandaUkraineUnited Arab EmiratesUnited KingdomUnited StatesUpper middle incomeUruguayVenezuela, RBVietnamWorldYemen, Rep.ZambiaZimbabwe Zeitlinie:
Diese Zeitleiste vorliegt die Graphik ab 1961 J. bis 2015 J. Fragile and conflict affected situations. Die Angaben bis 1960 J. sind nicht vorhanden. Die Zahl aktueller Beobachtungen nach Daten: 55.
Die Quelle (Bezeichnung):
Kennzahlen der Weltentwicklung
Die Quelle (Einrichtung):
World Bank staff estimates based data from International Monetary Fund's Direction of Trade database.
Kategorien:
Private Sector, Trade
Es wurde aktualisiert:
23 Apr 2017 Jahr
Kennzahlen der Wertänderungen vom Jahr zum Jahr
Minimum:
3.762
1 Jan 1979 Jahr
Maximum:
18.57
1 Jan 2014 Jahr
Zum Datum der Beobachtung
Wert
Absolute Veränderung
Die Veränderung bezüglich dem vorherigen Wert
1 Jan 1961 Jahr
7.56
+7.56
0.0%
1 Jan 1962 Jahr
7.096
-0.464
-6.14%
1 Jan 1963 Jahr
4.172
-2.924
-41.2%
1 Jan 1964 Jahr
6.964
+2.792
66.93%
1 Jan 1965 Jahr
6.025
-0.939
-13.48%
1 Jan 1966 Jahr
5.788
-0.238
-3.94%
1 Jan 1967 Jahr
6.435
+0.647
11.18%
1 Jan 1968 Jahr
5.936
-0.499
-7.76%
1 Jan 1969 Jahr
6.494
+0.558
9.4%
1 Jan 1970 Jahr
5.63
-0.863
-13.29%
1 Jan 1971 Jahr
6.309
+0.678
12.05%
1 Jan 1972 Jahr
6.447
+0.138
2.18%
1 Jan 1973 Jahr
4.882
-1.564
-24.27%
1 Jan 1974 Jahr
5.245
+0.363
7.44%
1 Jan 1975 Jahr
4.845
-0.4
-7.63%
1 Jan 1976 Jahr
3.854
-0.991
-20.46%
1 Jan 1977 Jahr
4.705
+0.851
22.07%
1 Jan 1978 Jahr
4.194
-0.511
-10.86%
1 Jan 1979 Jahr
3.762
-0.432
-10.3%
1 Jan 1980 Jahr
5.886
+2.124
56.45%
1 Jan 1981 Jahr
8.103
+2.218
37.68%
1 Jan 1982 Jahr
8.741
+0.638
7.87%
1 Jan 1983 Jahr
6.715
-2.026
-23.18%
1 Jan 1984 Jahr
4.218
-2.497
-37.19%
1 Jan 1985 Jahr
5.728
+1.51
35.8%
1 Jan 1986 Jahr
5.646
-0.082
-1.43%
1 Jan 1987 Jahr
4.948
-0.698
-12.36%
1 Jan 1988 Jahr
5.218
+0.27
5.45%
1 Jan 1989 Jahr
5.207
-0.01
-0.2%
1 Jan 1990 Jahr
7.39
+2.183
41.91%
1 Jan 1991 Jahr
8.017
+0.627
8.48%
1 Jan 1992 Jahr
6.693
-1.324
-16.51%
1 Jan 1993 Jahr
7.183
+0.49
7.32%
1 Jan 1994 Jahr
7.631
+0.448
6.23%
1 Jan 1995 Jahr
7.269
-0.361
-4.74%
1 Jan 1996 Jahr
6.86
-0.409
-5.63%
1 Jan 1997 Jahr
6.092
-0.768
-11.19%
1 Jan 1998 Jahr
7.247
+1.154
18.95%
1 Jan 1999 Jahr
6.558
-0.688
-9.5%
1 Jan 2000 Jahr
7.907
+1.348
20.56%
1 Jan 2001 Jahr
8.868
+0.961
12.16%
1 Jan 2002 Jahr
9.875
+1.007
11.36%
1 Jan 2003 Jahr
10.269
+0.394
3.99%
1 Jan 2004 Jahr
10.642
+0.373
3.64%
1 Jan 2005 Jahr
15.47
+4.828
45.37%
1 Jan 2006 Jahr
17.804
+2.334
15.09%
1 Jan 2007 Jahr
17.456
-0.348
-1.96%
1 Jan 2008 Jahr
17.318
-0.139
-0.79%
1 Jan 2009 Jahr
17.587
+0.269
1.55%
1 Jan 2010 Jahr
15.282
-2.305
-13.11%
1 Jan 2011 Jahr
16.077
+0.795
5.2%
1 Jan 2012 Jahr
17.241
+1.164
7.24%
1 Jan 2013 Jahr
16.939
-0.302
-1.75%
1 Jan 2014 Jahr
18.57
+1.63
9.62%
1 Jan 2015 Jahr
18.288
-0.282
-1.52%
Bewertung der Länder gemäß mit laufender Statistik nach Jahren


Kommentare: