29
/de/
de
AIzaSyAYiBZKx7MnpbEhh9jyipgxe19OcubqV5w
April 1, 2024
34017
Fragile and conflict affected situations
FCS
false
2
1
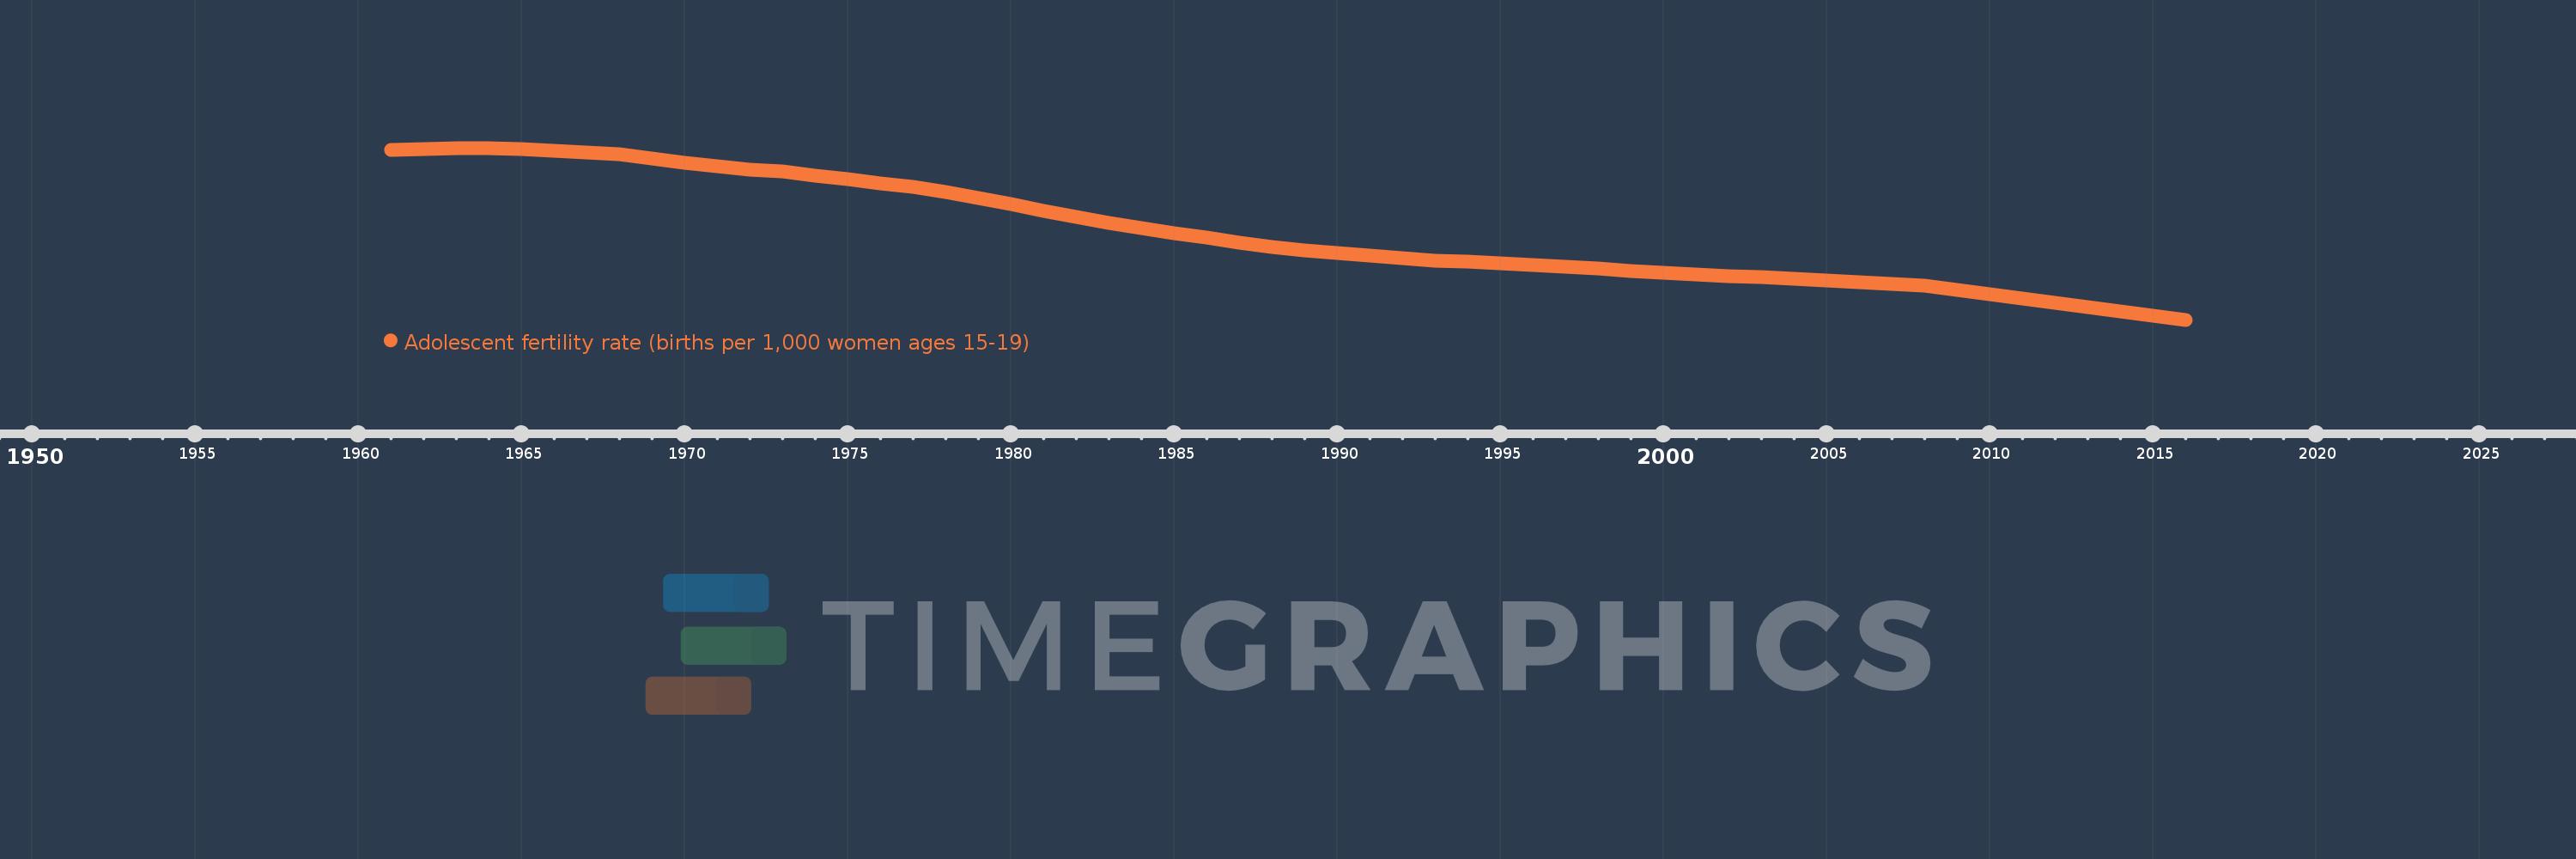
Adolescent fertility rate (births per 1,000 women ages 15-19)
2016,2015,2014,2013,2012,2011,2010,2009,2008,2007,2006,2005,2004,2003,2002,2001,2000,1999,1998,1997,1996,1995,1994,1993,1992,1991,1990,1989,1988,1987,1986,1985,1984,1983,1982,1981,1980,1979,1978,1977,1976,1975,1974,1973,1972,1971,1970,1969,1968,1967,1966,1965,1964,1963,1962,1961
Diese Statistik in anderen Ländern:
AfghanistanAlbaniaAlgeriaAngolaAntigua and BarbudaArab WorldArgentinaArmeniaArubaAustraliaAustriaAzerbaijanBahamas, TheBahrainBangladeshBarbadosBelarusBelgiumBelizeBeninBhutanBoliviaBosnia and HerzegovinaBotswanaBrazilBrunei DarussalamBulgariaBurkina FasoBurundiCabo VerdeCambodiaCameroonCanadaCaribbean small statesCentral African RepublicCentral Europe and the BalticsChadChannel IslandsChileChinaColombiaComorosCongo, Dem. Rep.Congo, Rep.Costa RicaCote d'IvoireCroatiaCubaCuracaoCyprusCzech RepublicDenmarkDjiboutiDominican RepublicEarly-demographic dividendEast Asia & PacificEast Asia & Pacific (excluding high income)East Asia & Pacific (IDA & IBRD countries)EcuadorEgypt, Arab Rep.El SalvadorEquatorial GuineaEritreaEstoniaEthiopiaEuro areaEurope & Central AsiaEurope & Central Asia (excluding high income)Europe & Central Asia (IDA & IBRD countries)European UnionFijiFinlandFragile and conflict affected situationsFranceFrench PolynesiaGabonGambia, TheGeorgiaGermanyGhanaGreeceGrenadaGuamGuatemalaGuineaGuinea-BissauGuyanaHaitiHeavily indebted poor countries (HIPC)High incomeHondurasHong Kong SAR, ChinaHungaryIBRD onlyIcelandIDA & IBRD totalIDA blendIDA onlyIDA totalIndiaIndonesiaIran, Islamic Rep.IraqIrelandIsraelItalyJamaicaJapanJordanKazakhstanKenyaKiribatiKorea, Dem. People’s Rep.Korea, Rep.KuwaitKyrgyz RepublicLao PDRLate-demographic dividendLatin America & Caribbean Latin America & Caribbean (excluding high income)Latin America & the Caribbean (IDA & IBRD countries)LatviaLeast developed countries: UN classificationLebanonLesothoLiberiaLibyaLithuaniaLow & middle incomeLow incomeLower middle incomeLuxembourgMacao SAR, ChinaMacedonia, FYRMadagascarMalawiMalaysiaMaldivesMaliMaltaMauritaniaMauritiusMexicoMicronesia, Fed. Sts.Middle East & North AfricaMiddle East & North Africa (excluding high income)Middle East & North Africa (IDA & IBRD countries)Middle incomeMoldovaMongoliaMontenegroMoroccoMozambiqueMyanmarNamibiaNepalNetherlandsNew CaledoniaNew ZealandNicaraguaNigerNigeriaNorth AmericaNorwayOECD membersOmanOther small statesPacific island small statesPakistanPanamaPapua New GuineaParaguayPeruPhilippinesPolandPortugalPost-demographic dividendPre-demographic dividendPuerto RicoQatarRomaniaRussian FederationRwandaSamoaSao Tome and PrincipeSaudi ArabiaSenegalSerbiaSeychellesSierra LeoneSingaporeSlovak RepublicSloveniaSmall statesSolomon IslandsSomaliaSouth AfricaSouth AsiaSouth Asia (IDA & IBRD)South SudanSpainSri LankaSt. LuciaSt. Vincent and the GrenadinesSub-Saharan Africa Sub-Saharan Africa (excluding high income)Sub-Saharan Africa (IDA & IBRD countries)SudanSurinameSwazilandSwedenSwitzerlandSyrian Arab RepublicTajikistanTanzaniaThailandTimor-LesteTogoTongaTrinidad and TobagoTunisiaTurkeyTurkmenistanUgandaUkraineUnited Arab EmiratesUnited KingdomUnited StatesUpper middle incomeUruguayUzbekistanVanuatuVenezuela, RBVietnamVirgin Islands (U.S.)West Bank and GazaWorldYemen, Rep.ZambiaZimbabwe Zeitlinie:
Diese Zeitleiste vorliegt die Graphik ab 1961 J. bis 2016 J. Fragile and conflict affected situations. Die Angaben bis 1960 J. sind nicht vorhanden. Die Zahl aktueller Beobachtungen nach Daten: 56.
Die Quelle (Bezeichnung):
Kennzahlen der Weltentwicklung
Die Quelle (Einrichtung):
United Nations Population Division, World Population Prospects.
Kategorien:
Health, Gender, Social Development
Es wurde aktualisiert:
23 Apr 2017 Jahr
Kennzahlen der Wertänderungen vom Jahr zum Jahr
Minimum:
83.905
1 Jan 2016 Jahr
Maximum:
143.053
1 Jan 1963 Jahr
Zum Datum der Beobachtung
Wert
Absolute Veränderung
Die Veränderung bezüglich dem vorherigen Wert
1 Jan 1961 Jahr
142.511
+142.511
0.0%
1 Jan 1962 Jahr
142.781
+0.27
0.19%
1 Jan 1963 Jahr
143.053
+0.272
0.19%
1 Jan 1964 Jahr
142.915
-0.138
-0.1%
1 Jan 1965 Jahr
142.627
-0.288
-0.2%
1 Jan 1966 Jahr
142.168
-0.459
-0.32%
1 Jan 1967 Jahr
141.59
-0.578
-0.41%
1 Jan 1968 Jahr
140.902
-0.689
-0.49%
1 Jan 1969 Jahr
139.365
-1.537
-1.09%
1 Jan 1970 Jahr
137.944
-1.421
-1.02%
1 Jan 1971 Jahr
136.72
-1.224
-0.89%
1 Jan 1972 Jahr
135.689
-1.031
-0.75%
1 Jan 1973 Jahr
134.851
-0.837
-0.62%
1 Jan 1974 Jahr
133.599
-1.253
-0.93%
1 Jan 1975 Jahr
132.331
-1.267
-0.95%
1 Jan 1976 Jahr
130.976
-1.355
-1.02%
1 Jan 1977 Jahr
129.512
-1.464
-1.12%
1 Jan 1978 Jahr
127.988
-1.524
-1.18%
1 Jan 1979 Jahr
125.794
-2.194
-1.71%
1 Jan 1980 Jahr
123.607
-2.188
-1.74%
1 Jan 1981 Jahr
121.443
-2.164
-1.75%
1 Jan 1982 Jahr
119.274
-2.169
-1.79%
1 Jan 1983 Jahr
117.102
-2.172
-1.82%
1 Jan 1984 Jahr
115.45
-1.652
-1.41%
1 Jan 1985 Jahr
113.794
-1.656
-1.43%
1 Jan 1986 Jahr
112.147
-1.648
-1.45%
1 Jan 1987 Jahr
110.502
-1.645
-1.47%
1 Jan 1988 Jahr
108.884
-1.618
-1.46%
1 Jan 1989 Jahr
107.882
-1.001
-0.92%
1 Jan 1990 Jahr
106.93
-0.952
-0.88%
1 Jan 1991 Jahr
106.023
-0.907
-0.85%
1 Jan 1992 Jahr
105.144
-0.879
-0.83%
1 Jan 1993 Jahr
104.354
-0.79
-0.75%
1 Jan 1994 Jahr
103.899
-0.455
-0.44%
1 Jan 1995 Jahr
103.4
-0.499
-0.48%
1 Jan 1996 Jahr
102.827
-0.574
-0.55%
1 Jan 1997 Jahr
102.154
-0.672
-0.65%
1 Jan 1998 Jahr
101.428
-0.726
-0.71%
1 Jan 1999 Jahr
100.651
-0.777
-0.77%
1 Jan 2000 Jahr
99.953
-0.698
-0.69%
1 Jan 2001 Jahr
99.371
-0.582
-0.58%
1 Jan 2002 Jahr
98.91
-0.462
-0.46%
1 Jan 2003 Jahr
98.529
-0.381
-0.39%
1 Jan 2004 Jahr
97.996
-0.533
-0.54%
1 Jan 2005 Jahr
97.442
-0.554
-0.57%
1 Jan 2006 Jahr
96.833
-0.608
-0.62%
1 Jan 2007 Jahr
96.192
-0.641
-0.66%
1 Jan 2008 Jahr
95.506
-0.686
-0.71%
1 Jan 2009 Jahr
94.13
-1.375
-1.44%
1 Jan 2010 Jahr
92.712
-1.418
-1.51%
1 Jan 2011 Jahr
91.255
-1.457
-1.57%
1 Jan 2012 Jahr
89.791
-1.464
-1.6%
1 Jan 2013 Jahr
88.272
-1.52
-1.69%
1 Jan 2014 Jahr
86.884
-1.387
-1.57%
1 Jan 2015 Jahr
85.428
-1.456
-1.68%
1 Jan 2016 Jahr
83.905
-1.523
-1.78%
Bewertung der Länder gemäß mit laufender Statistik nach Jahren


Kommentare: