29
/de/
de
AIzaSyAYiBZKx7MnpbEhh9jyipgxe19OcubqV5w
April 1, 2024
33762
European Union
EUU
false
2
1
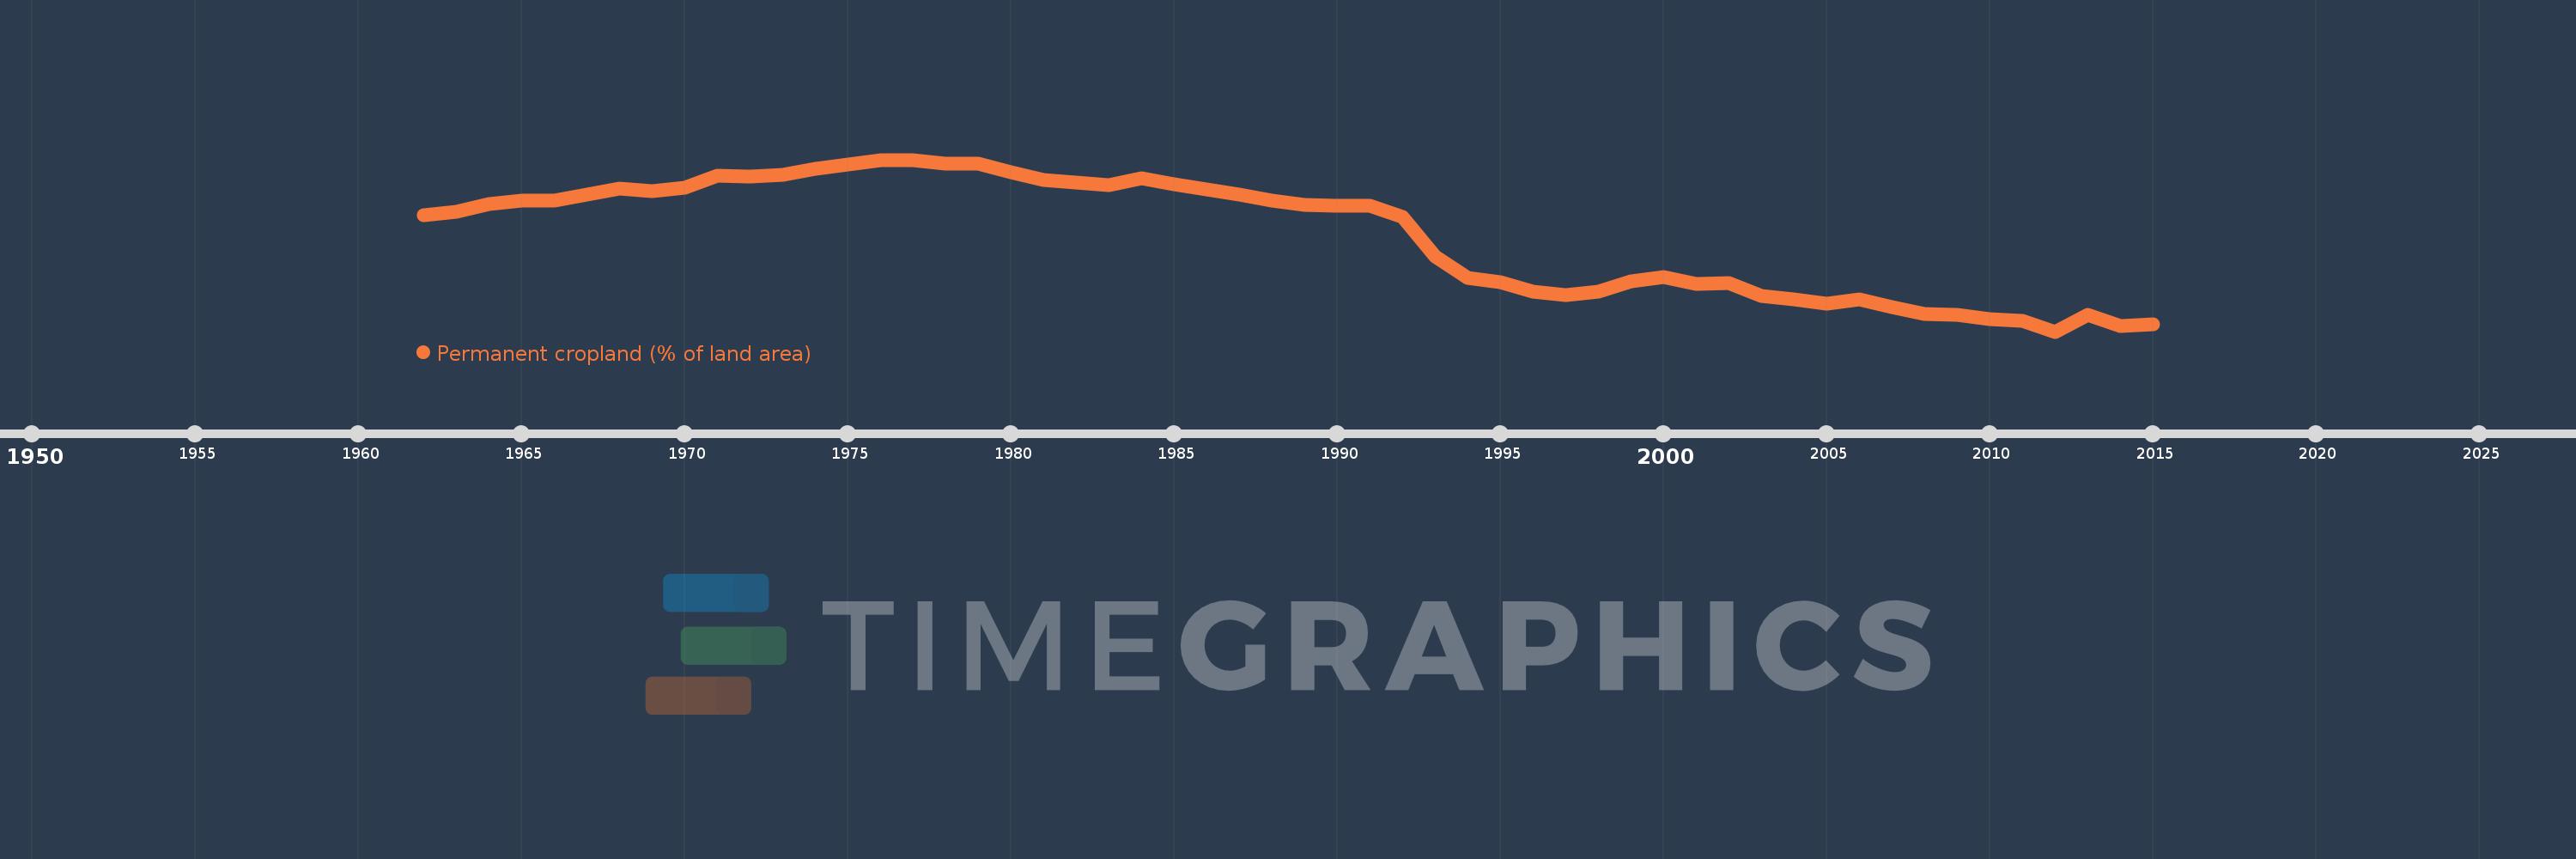
Permanent cropland (% of land area)
2015,2014,2013,2012,2011,2010,2009,2008,2007,2006,2005,2004,2003,2002,2001,2000,1999,1998,1997,1996,1995,1994,1993,1992,1991,1990,1989,1988,1987,1986,1985,1984,1983,1982,1981,1980,1979,1978,1977,1976,1975,1974,1973,1972,1971,1970,1969,1968,1967,1966,1965,1964,1963,1962
Diese Statistik in anderen Ländern:
AfghanistanAlbaniaAlgeriaAmerican SamoaAngolaAntigua and BarbudaArab WorldArgentinaArmeniaAustraliaAustriaAzerbaijanBahamas, TheBahrainBangladeshBarbadosBelarusBelgiumBelizeBeninBhutanBoliviaBosnia and HerzegovinaBotswanaBrazilBritish Virgin IslandsBrunei DarussalamBulgariaBurkina FasoBurundiCabo VerdeCambodiaCameroonCanadaCaribbean small statesCayman IslandsCentral African RepublicCentral Europe and the BalticsChadChileChinaColombiaComorosCongo, Dem. Rep.Congo, Rep.Costa RicaCote d'IvoireCroatiaCubaCyprusCzech RepublicDenmarkDominicaDominican RepublicEarly-demographic dividendEast Asia & PacificEast Asia & Pacific (excluding high income)East Asia & Pacific (IDA & IBRD countries)EcuadorEgypt, Arab Rep.El SalvadorEquatorial GuineaEritreaEstoniaEthiopiaEuro areaEurope & Central AsiaEurope & Central Asia (excluding high income)Europe & Central Asia (IDA & IBRD countries)European UnionFijiFinlandFragile and conflict affected situationsFranceFrench PolynesiaGabonGambia, TheGeorgiaGermanyGhanaGreeceGrenadaGuamGuatemalaGuineaGuinea-BissauGuyanaHaitiHeavily indebted poor countries (HIPC)High incomeHondurasHong Kong SAR, ChinaHungaryIBRD onlyIDA & IBRD totalIDA blendIDA onlyIDA totalIndiaIndonesiaIran, Islamic Rep.IraqIrelandIsraelItalyJamaicaJapanJordanKazakhstanKenyaKiribatiKorea, Dem. People’s Rep.Korea, Rep.KuwaitKyrgyz RepublicLao PDRLate-demographic dividendLatin America & Caribbean Latin America & Caribbean (excluding high income)Latin America & the Caribbean (IDA & IBRD countries)LatviaLeast developed countries: UN classificationLebanonLesothoLiberiaLibyaLithuaniaLow & middle incomeLow incomeLower middle incomeLuxembourgMacedonia, FYRMadagascarMalawiMalaysiaMaldivesMaliMaltaMarshall IslandsMauritaniaMauritiusMexicoMicronesia, Fed. Sts.Middle East & North AfricaMiddle East & North Africa (excluding high income)Middle East & North Africa (IDA & IBRD countries)Middle incomeMoldovaMongoliaMontenegroMoroccoMozambiqueMyanmarNamibiaNauruNepalNetherlandsNew CaledoniaNew ZealandNicaraguaNigerNigeriaNorth AmericaNorthern Mariana IslandsNorwayOECD membersOmanOther small statesPacific island small statesPakistanPalauPanamaPapua New GuineaParaguayPeruPhilippinesPolandPortugalPost-demographic dividendPre-demographic dividendPuerto RicoQatarRomaniaRussian FederationRwandaSamoaSao Tome and PrincipeSaudi ArabiaSenegalSerbiaSeychellesSierra LeoneSingaporeSlovak RepublicSloveniaSmall statesSolomon IslandsSomaliaSouth AfricaSouth AsiaSouth Asia (IDA & IBRD)SpainSri LankaSt. Kitts and NevisSt. LuciaSt. Vincent and the GrenadinesSub-Saharan Africa Sub-Saharan Africa (excluding high income)Sub-Saharan Africa (IDA & IBRD countries)SudanSurinameSwazilandSwedenSwitzerlandSyrian Arab RepublicTajikistanTanzaniaThailandTimor-LesteTogoTongaTrinidad and TobagoTunisiaTurkeyTurkmenistanTuvaluUgandaUkraineUnited Arab EmiratesUnited KingdomUnited StatesUpper middle incomeUruguayUzbekistanVanuatuVenezuela, RBVietnamVirgin Islands (U.S.)West Bank and GazaWorldYemen, Rep.ZambiaZimbabwe Zeitlinie:
Diese Zeitleiste vorliegt die Graphik ab 1962 J. bis 2015 J. European Union. Die Angaben bis 1961 J. sind nicht vorhanden. Die Zahl aktueller Beobachtungen nach Daten: 54.
Die Quelle (Bezeichnung):
Kennzahlen der Weltentwicklung
Die Quelle (Einrichtung):
Food and Agriculture Organization, electronic files and web site.
Kategorien:
Agriculture & Rural Development
Es wurde aktualisiert:
23 Apr 2017 Jahr
Kennzahlen der Wertänderungen vom Jahr zum Jahr
Minimum:
2.79
1 Jan 2012 Jahr
Maximum:
3.606
1 Jan 1977 Jahr
Zum Datum der Beobachtung
Wert
Absolute Veränderung
Die Veränderung bezüglich dem vorherigen Wert
1 Jan 1962 Jahr
3.344
+3.344
0.0%
1 Jan 1963 Jahr
3.361
+0.017
0.51%
1 Jan 1964 Jahr
3.397
+0.036
1.08%
1 Jan 1965 Jahr
3.413
+0.016
0.47%
1 Jan 1966 Jahr
3.413
+0.0
0.0%
1 Jan 1967 Jahr
3.442
+0.028
0.83%
1 Jan 1968 Jahr
3.469
+0.027
0.78%
1 Jan 1969 Jahr
3.459
-0.009
-0.27%
1 Jan 1970 Jahr
3.473
+0.014
0.41%
1 Jan 1971 Jahr
3.529
+0.056
1.6%
1 Jan 1972 Jahr
3.526
-0.003
-0.08%
1 Jan 1973 Jahr
3.534
+0.007
0.21%
1 Jan 1974 Jahr
3.562
+0.029
0.81%
1 Jan 1975 Jahr
3.583
+0.021
0.59%
1 Jan 1976 Jahr
3.603
+0.02
0.55%
1 Jan 1977 Jahr
3.606
+0.002
0.07%
1 Jan 1978 Jahr
3.589
-0.017
-0.46%
1 Jan 1979 Jahr
3.587
-0.002
-0.05%
1 Jan 1980 Jahr
3.545
-0.042
-1.17%
1 Jan 1981 Jahr
3.51
-0.035
-0.98%
1 Jan 1982 Jahr
3.498
-0.013
-0.36%
1 Jan 1983 Jahr
3.485
-0.013
-0.36%
1 Jan 1984 Jahr
3.517
+0.032
0.92%
1 Jan 1985 Jahr
3.491
-0.027
-0.76%
1 Jan 1986 Jahr
3.464
-0.027
-0.76%
1 Jan 1987 Jahr
3.44
-0.024
-0.68%
1 Jan 1988 Jahr
3.412
-0.028
-0.81%
1 Jan 1989 Jahr
3.393
-0.019
-0.56%
1 Jan 1990 Jahr
3.389
-0.004
-0.11%
1 Jan 1991 Jahr
3.388
-0.001
-0.03%
1 Jan 1992 Jahr
3.335
-0.053
-1.58%
1 Jan 1993 Jahr
3.147
-0.188
-5.63%
1 Jan 1994 Jahr
3.043
-0.105
-3.32%
1 Jan 1995 Jahr
3.025
-0.018
-0.59%
1 Jan 1996 Jahr
2.978
-0.047
-1.54%
1 Jan 1997 Jahr
2.964
-0.014
-0.48%
1 Jan 1998 Jahr
2.981
+0.017
0.58%
1 Jan 1999 Jahr
3.028
+0.047
1.59%
1 Jan 2000 Jahr
3.049
+0.021
0.69%
1 Jan 2001 Jahr
3.015
-0.034
-1.13%
1 Jan 2002 Jahr
3.02
+0.005
0.16%
1 Jan 2003 Jahr
2.958
-0.062
-2.06%
1 Jan 2004 Jahr
2.942
-0.016
-0.53%
1 Jan 2005 Jahr
2.922
-0.02
-0.69%
1 Jan 2006 Jahr
2.945
+0.023
0.79%
1 Jan 2007 Jahr
2.907
-0.038
-1.28%
1 Jan 2008 Jahr
2.874
-0.033
-1.14%
1 Jan 2009 Jahr
2.868
-0.006
-0.21%
1 Jan 2010 Jahr
2.848
-0.02
-0.71%
1 Jan 2011 Jahr
2.842
-0.006
-0.22%
1 Jan 2012 Jahr
2.79
-0.051
-1.81%
1 Jan 2013 Jahr
2.869
+0.079
2.83%
1 Jan 2014 Jahr
2.815
-0.054
-1.89%
1 Jan 2015 Jahr
2.824
+0.009
0.33%
Bewertung der Länder gemäß mit laufender Statistik nach Jahren


Kommentare: