29
/de/
de
AIzaSyAYiBZKx7MnpbEhh9jyipgxe19OcubqV5w
April 1, 2024
33412
European Union
EUU
false
2
1
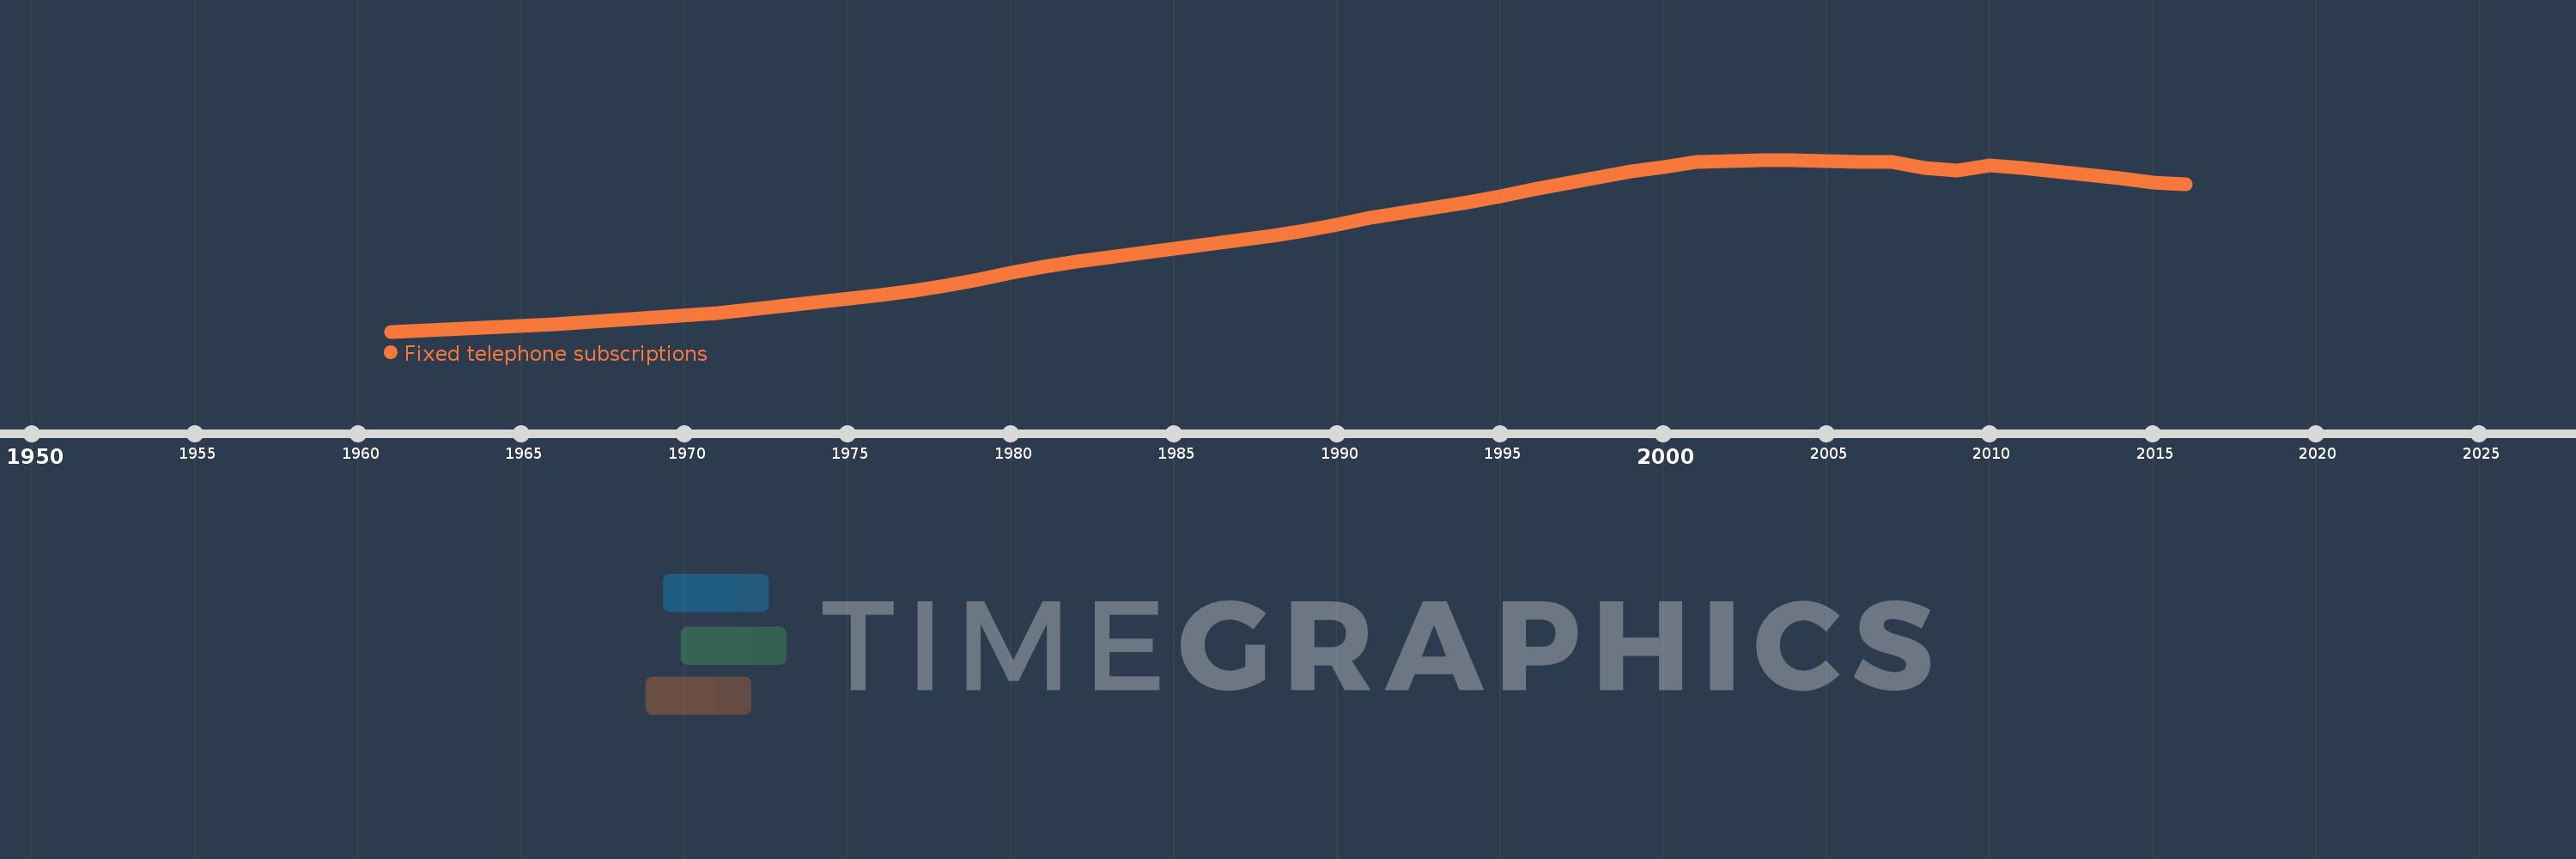
Fixed telephone subscriptions
2016,2015,2014,2013,2012,2011,2010,2009,2008,2007,2006,2005,2004,2003,2002,2001,2000,1999,1998,1997,1996,1995,1994,1993,1992,1991,1990,1989,1988,1987,1986,1985,1984,1983,1982,1981,1980,1979,1978,1977,1976,1971,1966,1961
Diese Statistik in anderen Ländern:
AfghanistanAlbaniaAlgeriaAmerican SamoaAndorraAngolaAntigua and BarbudaArab WorldArgentinaArmeniaArubaAustraliaAustriaAzerbaijanBahamas, TheBahrainBangladeshBarbadosBelarusBelgiumBelizeBeninBermudaBhutanBoliviaBosnia and HerzegovinaBotswanaBrazilBritish Virgin IslandsBrunei DarussalamBulgariaBurkina FasoBurundiCabo VerdeCambodiaCameroonCanadaCaribbean small statesCayman IslandsCentral African RepublicCentral Europe and the BalticsChadChileChinaColombiaComorosCongo, Dem. Rep.Congo, Rep.Costa RicaCote d'IvoireCroatiaCubaCuracaoCyprusCzech RepublicDenmarkDjiboutiDominicaDominican RepublicEarly-demographic dividendEast Asia & PacificEast Asia & Pacific (excluding high income)East Asia & Pacific (IDA & IBRD countries)EcuadorEgypt, Arab Rep.El SalvadorEquatorial GuineaEritreaEstoniaEthiopiaEuro areaEurope & Central AsiaEurope & Central Asia (excluding high income)Europe & Central Asia (IDA & IBRD countries)European UnionFaroe IslandsFijiFinlandFragile and conflict affected situationsFranceFrench PolynesiaGabonGambia, TheGeorgiaGermanyGhanaGibraltarGreeceGreenlandGrenadaGuamGuatemalaGuineaGuinea-BissauGuyanaHaitiHeavily indebted poor countries (HIPC)High incomeHondurasHong Kong SAR, ChinaHungaryIBRD onlyIcelandIDA & IBRD totalIDA blendIDA onlyIDA totalIndiaIndonesiaIran, Islamic Rep.IraqIrelandIsraelItalyJamaicaJapanJordanKazakhstanKenyaKiribatiKorea, Dem. People’s Rep.Korea, Rep.KosovoKuwaitKyrgyz RepublicLao PDRLate-demographic dividendLatin America & Caribbean Latin America & Caribbean (excluding high income)Latin America & the Caribbean (IDA & IBRD countries)LatviaLeast developed countries: UN classificationLebanonLesothoLiberiaLibyaLiechtensteinLithuaniaLow & middle incomeLow incomeLower middle incomeLuxembourgMacao SAR, ChinaMacedonia, FYRMadagascarMalawiMalaysiaMaldivesMaliMaltaMarshall IslandsMauritaniaMauritiusMexicoMicronesia, Fed. Sts.Middle East & North AfricaMiddle East & North Africa (excluding high income)Middle East & North Africa (IDA & IBRD countries)Middle incomeMoldovaMonacoMongoliaMontenegroMoroccoMozambiqueMyanmarNamibiaNauruNepalNetherlandsNew CaledoniaNew ZealandNicaraguaNigerNigeriaNorth AmericaNorthern Mariana IslandsNorwayOECD membersOmanOther small statesPacific island small statesPakistanPalauPanamaPapua New GuineaParaguayPeruPhilippinesPolandPortugalPost-demographic dividendPre-demographic dividendPuerto RicoQatarRomaniaRussian FederationRwandaSamoaSan MarinoSao Tome and PrincipeSaudi ArabiaSenegalSerbiaSeychellesSierra LeoneSingaporeSlovak RepublicSloveniaSmall statesSolomon IslandsSomaliaSouth AfricaSouth AsiaSouth Asia (IDA & IBRD)South SudanSpainSri LankaSt. Kitts and NevisSt. LuciaSt. Vincent and the GrenadinesSub-Saharan Africa Sub-Saharan Africa (excluding high income)Sub-Saharan Africa (IDA & IBRD countries)SudanSurinameSwazilandSwedenSwitzerlandSyrian Arab RepublicTajikistanTanzaniaThailandTimor-LesteTogoTongaTrinidad and TobagoTunisiaTurkeyTurkmenistanTurks and Caicos IslandsTuvaluUgandaUkraineUnited Arab EmiratesUnited KingdomUnited StatesUpper middle incomeUruguayUzbekistanVanuatuVenezuela, RBVietnamVirgin Islands (U.S.)West Bank and GazaWorldYemen, Rep.ZambiaZimbabwe Zeitlinie:
Diese Zeitleiste vorliegt die Graphik ab 1961 J. bis 2016 J. European Union. Die Angaben bis 1960 J. sind nicht vorhanden. Die Zahl aktueller Beobachtungen nach Daten: 44.
Die Quelle (Bezeichnung):
Kennzahlen der Weltentwicklung
Die Quelle (Einrichtung):
International Telecommunication Union, World Telecommunication/ICT Development Report and database, and World Bank estimates.
Kategorien:
Infrastructure
Es wurde aktualisiert:
23 Apr 2017 Jahr
Kennzahlen der Wertänderungen vom Jahr zum Jahr
im Durchschnitt:
171.204 Mln.
Minimum:
21.758 Mln.
1 Jan 1961 Jahr
Maximum:
242.374 Mln.
1 Jan 2003 Jahr
Zum Datum der Beobachtung
Wert
Absolute Veränderung
Die Veränderung bezüglich dem vorherigen Wert
1 Jan 1961 Jahr
21.758 Mln.
+21.758 Mln.
0.0%
1 Jan 1966 Jahr
31.241 Mln.
+9.482 Mln.
43.58%
1 Jan 1971 Jahr
45.852 Mln.
+14.611 Mln.
46.77%
1 Jan 1976 Jahr
68.433 Mln.
+22.581 Mln.
49.25%
1 Jan 1977 Jahr
74.286 Mln.
+5.853 Mln.
8.55%
1 Jan 1978 Jahr
81.183 Mln.
+6.897 Mln.
9.28%
1 Jan 1979 Jahr
88.639 Mln.
+7.456 Mln.
9.18%
1 Jan 1980 Jahr
97.862 Mln.
+9.223 Mln.
10.4%
1 Jan 1981 Jahr
105.141 Mln.
+7.278 Mln.
7.44%
1 Jan 1982 Jahr
111.704 Mln.
+6.563 Mln.
6.24%
1 Jan 1983 Jahr
117.231 Mln.
+5.527 Mln.
4.95%
1 Jan 1984 Jahr
122.954 Mln.
+5.723 Mln.
4.88%
1 Jan 1985 Jahr
128.627 Mln.
+5.673 Mln.
4.61%
1 Jan 1986 Jahr
134.258 Mln.
+5.631 Mln.
4.38%
1 Jan 1987 Jahr
139.243 Mln.
+4.985 Mln.
3.71%
1 Jan 1988 Jahr
144.938 Mln.
+5.695 Mln.
4.09%
1 Jan 1989 Jahr
151.45 Mln.
+6.512 Mln.
4.49%
1 Jan 1990 Jahr
158.712 Mln.
+7.261 Mln.
4.79%
1 Jan 1991 Jahr
167.797 Mln.
+9.085 Mln.
5.72%
1 Jan 1992 Jahr
174.628 Mln.
+6.831 Mln.
4.07%
1 Jan 1993 Jahr
181.665 Mln.
+7.037 Mln.
4.03%
1 Jan 1994 Jahr
188.107 Mln.
+6.442 Mln.
3.55%
1 Jan 1995 Jahr
195.458 Mln.
+7.351 Mln.
3.91%
1 Jan 1996 Jahr
204.173 Mln.
+8.715 Mln.
4.46%
1 Jan 1997 Jahr
212.06 Mln.
+7.888 Mln.
3.86%
1 Jan 1998 Jahr
220.022 Mln.
+7.962 Mln.
3.75%
1 Jan 1999 Jahr
227.305 Mln.
+7.283 Mln.
3.31%
1 Jan 2000 Jahr
233.421 Mln.
+6.116 Mln.
2.69%
1 Jan 2001 Jahr
240.106 Mln.
+6.685 Mln.
2.86%
1 Jan 2002 Jahr
241.066 Mln.
+960.173 Tsnd.
0.4%
1 Jan 2003 Jahr
242.374 Mln.
+1.308 Mln.
0.54%
1 Jan 2004 Jahr
241.613 Mln.
-760.382 Tsnd.
-0.31%
1 Jan 2005 Jahr
240.91 Mln.
-703.686 Tsnd.
-0.29%
1 Jan 2006 Jahr
239.193 Mln.
-1.717 Mln.
-0.71%
1 Jan 2007 Jahr
239.171 Mln.
-21.211 Tsnd.
-0.01%
1 Jan 2008 Jahr
231.477 Mln.
-7.695 Mln.
-3.22%
1 Jan 2009 Jahr
228.045 Mln.
-3.432 Mln.
-1.48%
1 Jan 2010 Jahr
235.746 Mln.
+7.701 Mln.
3.38%
1 Jan 2011 Jahr
232.231 Mln.
-3.515 Mln.
-1.49%
1 Jan 2012 Jahr
227.894 Mln.
-4.337 Mln.
-1.87%
1 Jan 2013 Jahr
222.747 Mln.
-5.147 Mln.
-2.26%
1 Jan 2014 Jahr
218.24 Mln.
-4.507 Mln.
-2.02%
1 Jan 2015 Jahr
213.571 Mln.
-4.669 Mln.
-2.14%
1 Jan 2016 Jahr
210.424 Mln.
-3.147 Mln.
-1.47%
Bewertung der Länder gemäß mit laufender Statistik nach Jahren


Kommentare: