29
/de/
de
AIzaSyAYiBZKx7MnpbEhh9jyipgxe19OcubqV5w
April 1, 2024
33277
European Union
EUU
false
2
1
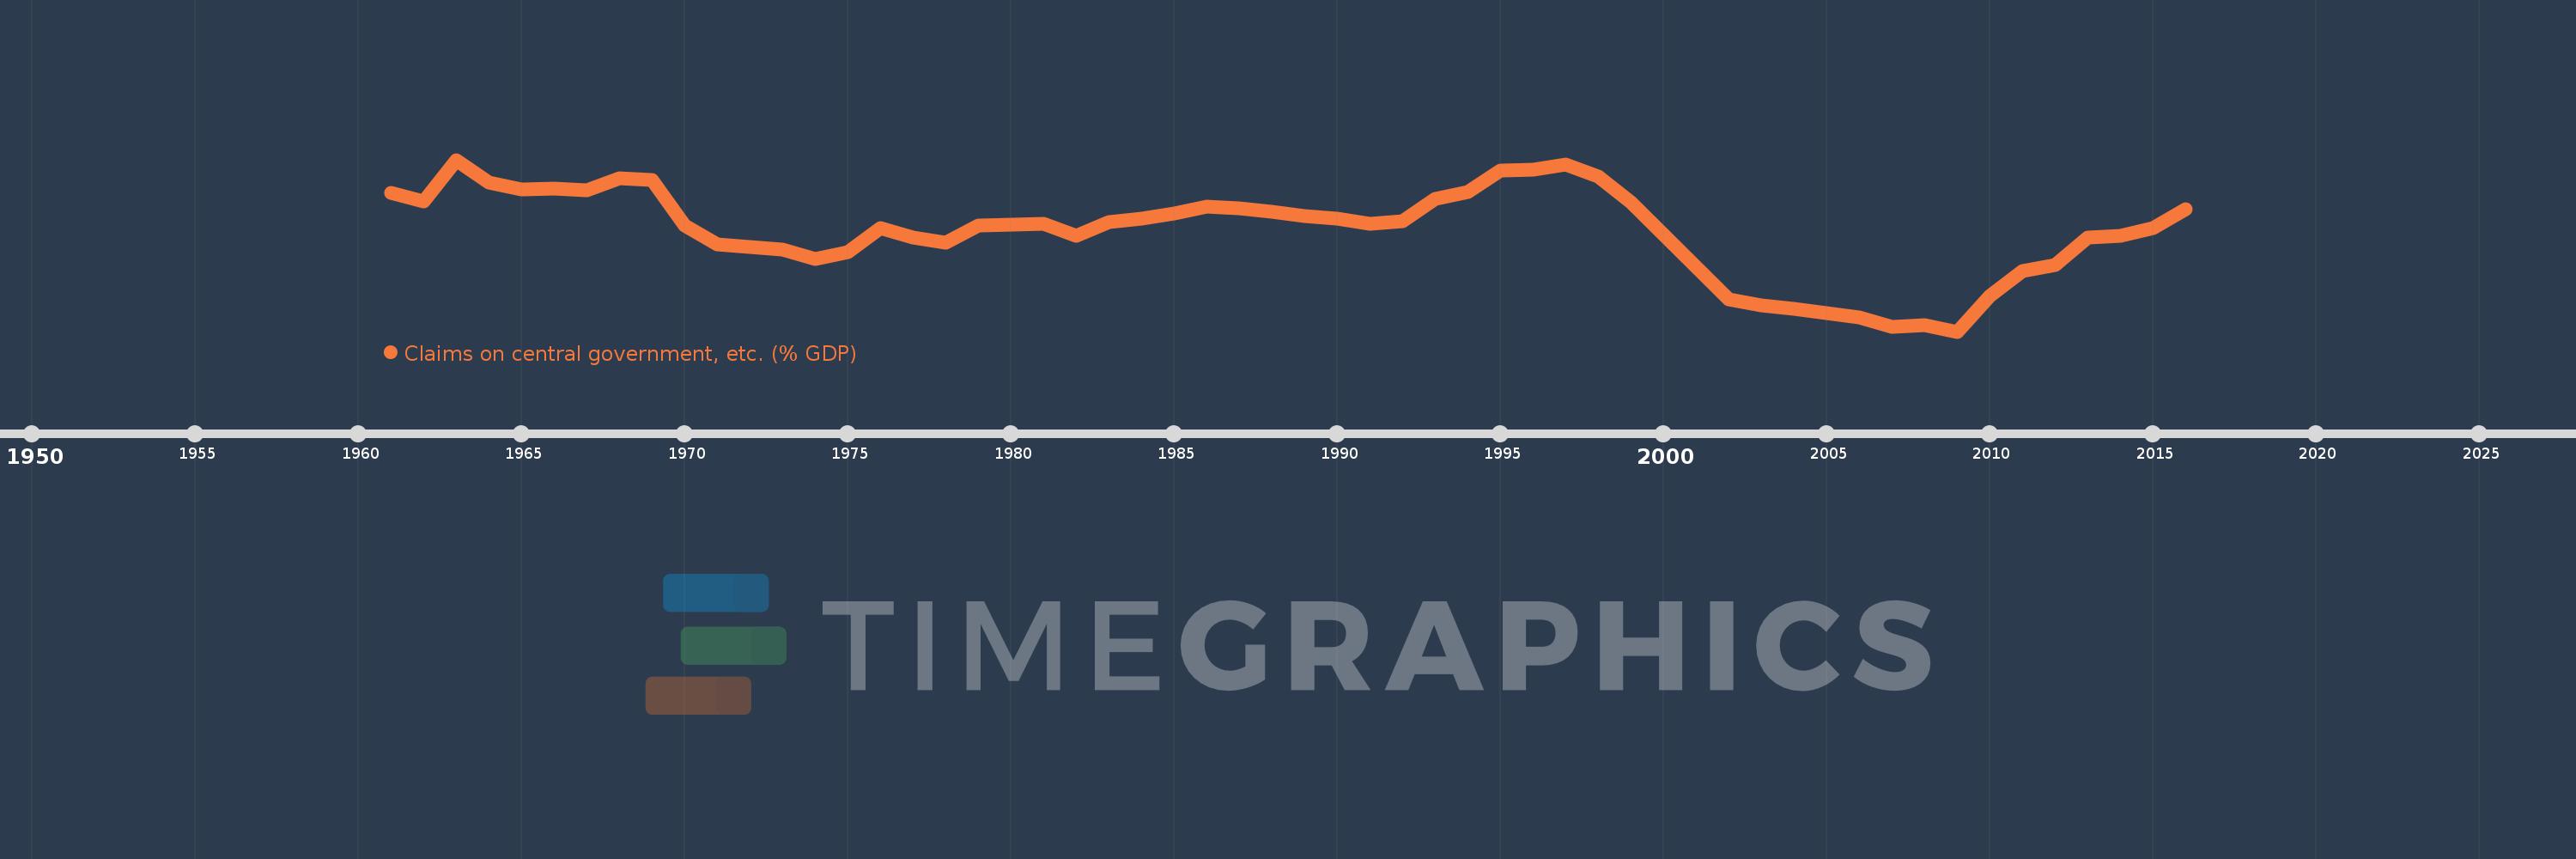
Claims on central government, etc. (% GDP)
2016,2015,2014,2013,2012,2011,2010,2009,2008,2007,2006,2005,2004,2003,2002,1999,1998,1997,1996,1995,1994,1993,1992,1991,1990,1989,1988,1987,1986,1985,1984,1983,1982,1981,1980,1979,1978,1977,1976,1975,1974,1973,1972,1971,1970,1969,1968,1967,1966,1965,1964,1963,1962,1961
Diese Statistik in anderen Ländern:
AfghanistanAlbaniaAlgeriaAngolaAntigua and BarbudaArab WorldArgentinaArmeniaArubaAustraliaAustriaAzerbaijanBahamas, TheBahrainBangladeshBarbadosBelarusBelgiumBelizeBeninBhutanBoliviaBosnia and HerzegovinaBotswanaBrazilBrunei DarussalamBulgariaBurkina FasoBurundiCabo VerdeCambodiaCameroonCanadaCaribbean small statesCentral African RepublicCentral Europe and the BalticsChadChileChinaColombiaComorosCongo, Dem. Rep.Congo, Rep.Costa RicaCote d'IvoireCroatiaCyprusCzech RepublicDenmarkDjiboutiDominicaDominican RepublicEarly-demographic dividendEast Asia & PacificEast Asia & Pacific (excluding high income)East Asia & Pacific (IDA & IBRD countries)EcuadorEgypt, Arab Rep.El SalvadorEquatorial GuineaEritreaEstoniaEthiopiaEuro areaEurope & Central AsiaEurope & Central Asia (excluding high income)Europe & Central Asia (IDA & IBRD countries)European UnionFijiFinlandFragile and conflict affected situationsFranceGabonGambia, TheGeorgiaGermanyGhanaGreeceGrenadaGuatemalaGuineaGuinea-BissauGuyanaHaitiHeavily indebted poor countries (HIPC)High incomeHondurasHong Kong SAR, ChinaHungaryIBRD onlyIcelandIDA & IBRD totalIDA blendIDA onlyIDA totalIndiaIndonesiaIran, Islamic Rep.IraqIrelandIsraelItalyJamaicaJapanJordanKazakhstanKenyaKorea, Rep.KosovoKuwaitKyrgyz RepublicLao PDRLate-demographic dividendLatin America & Caribbean Latin America & Caribbean (excluding high income)Latin America & the Caribbean (IDA & IBRD countries)LatviaLeast developed countries: UN classificationLebanonLesothoLiberiaLibyaLithuaniaLow & middle incomeLow incomeLower middle incomeLuxembourgMacao SAR, ChinaMacedonia, FYRMadagascarMalawiMalaysiaMaldivesMaliMaltaMauritaniaMauritiusMexicoMicronesia, Fed. Sts.Middle East & North AfricaMiddle East & North Africa (excluding high income)Middle East & North Africa (IDA & IBRD countries)Middle incomeMoldovaMongoliaMontenegroMoroccoMozambiqueMyanmarNamibiaNepalNetherlandsNew ZealandNicaraguaNigerNigeriaNorth AmericaNorwayOECD membersOmanOther small statesPacific island small statesPakistanPanamaPapua New GuineaParaguayPeruPhilippinesPolandPortugalPost-demographic dividendPre-demographic dividendQatarRomaniaRussian FederationRwandaSamoaSao Tome and PrincipeSaudi ArabiaSenegalSerbiaSeychellesSierra LeoneSingaporeSlovak RepublicSloveniaSmall statesSolomon IslandsSouth AfricaSouth AsiaSouth Asia (IDA & IBRD)South SudanSpainSri LankaSt. Kitts and NevisSt. LuciaSt. Vincent and the GrenadinesSub-Saharan Africa Sub-Saharan Africa (excluding high income)Sub-Saharan Africa (IDA & IBRD countries)SudanSurinameSwazilandSwedenSwitzerlandSyrian Arab RepublicTajikistanTanzaniaThailandTimor-LesteTogoTongaTrinidad and TobagoTunisiaTurkeyUgandaUkraineUnited Arab EmiratesUnited KingdomUnited StatesUpper middle incomeUruguayVanuatuVenezuela, RBVietnamWest Bank and GazaWorldYemen, Rep.ZambiaZimbabwe Zeitlinie:
Diese Zeitleiste vorliegt die Graphik ab 1961 J. bis 2016 J. European Union. Die Angaben bis 1960 J. sind nicht vorhanden. Die Zahl aktueller Beobachtungen nach Daten: 54.
Die Quelle (Bezeichnung):
Kennzahlen der Weltentwicklung
Die Quelle (Einrichtung):
International Monetary Fund, International Financial Statistics and data files, and World Bank and OECD GDP estimates.
Kategorien:
Financial Sector
Es wurde aktualisiert:
23 Apr 2017 Jahr
Kennzahlen der Wertänderungen vom Jahr zum Jahr
Minimum:
4.693
1 Jan 2009 Jahr
Maximum:
22.312
1 Jan 1963 Jahr
Zum Datum der Beobachtung
Wert
Absolute Veränderung
Die Veränderung bezüglich dem vorherigen Wert
1 Jan 1961 Jahr
18.938
+18.938
0.0%
1 Jan 1962 Jahr
18.029
-0.909
-4.8%
1 Jan 1963 Jahr
22.312
+4.283
23.76%
1 Jan 1964 Jahr
20.008
-2.304
-10.33%
1 Jan 1965 Jahr
19.27
-0.738
-3.69%
1 Jan 1966 Jahr
19.399
+0.128
0.67%
1 Jan 1967 Jahr
19.22
-0.179
-0.92%
1 Jan 1968 Jahr
20.411
+1.191
6.2%
1 Jan 1969 Jahr
20.239
-0.172
-0.84%
1 Jan 1970 Jahr
15.552
-4.686
-23.16%
1 Jan 1971 Jahr
13.645
-1.907
-12.26%
1 Jan 1972 Jahr
13.35
-0.295
-2.16%
1 Jan 1973 Jahr
13.09
-0.26
-1.95%
1 Jan 1974 Jahr
12.123
-0.967
-7.38%
1 Jan 1975 Jahr
12.867
+0.743
6.13%
1 Jan 1976 Jahr
15.284
+2.417
18.78%
1 Jan 1977 Jahr
14.369
-0.915
-5.99%
1 Jan 1978 Jahr
13.815
-0.553
-3.85%
1 Jan 1979 Jahr
15.561
+1.745
12.63%
1 Jan 1980 Jahr
15.682
+0.121
0.78%
1 Jan 1981 Jahr
15.782
+0.101
0.64%
1 Jan 1982 Jahr
14.552
-1.231
-7.8%
1 Jan 1983 Jahr
15.894
+1.342
9.22%
1 Jan 1984 Jahr
16.254
+0.36
2.27%
1 Jan 1985 Jahr
16.836
+0.582
3.58%
1 Jan 1986 Jahr
17.539
+0.703
4.18%
1 Jan 1987 Jahr
17.341
-0.198
-1.13%
1 Jan 1988 Jahr
17.02
-0.321
-1.85%
1 Jan 1989 Jahr
16.531
-0.489
-2.88%
1 Jan 1990 Jahr
16.271
-0.26
-1.57%
1 Jan 1991 Jahr
15.785
-0.486
-2.98%
1 Jan 1992 Jahr
16.02
+0.235
1.49%
1 Jan 1993 Jahr
18.272
+2.252
14.06%
1 Jan 1994 Jahr
18.977
+0.705
3.86%
1 Jan 1995 Jahr
21.22
+2.243
11.82%
1 Jan 1996 Jahr
21.299
+0.079
0.37%
1 Jan 1997 Jahr
21.812
+0.513
2.41%
1 Jan 1998 Jahr
20.585
-1.227
-5.63%
1 Jan 1999 Jahr
17.984
-2.601
-12.64%
1 Jan 2002 Jahr
7.956
-10.028
-55.76%
1 Jan 2003 Jahr
7.372
-0.583
-7.33%
1 Jan 2004 Jahr
7.059
-0.313
-4.24%
1 Jan 2005 Jahr
6.547
-0.512
-7.26%
1 Jan 2006 Jahr
6.124
-0.424
-6.47%
1 Jan 2007 Jahr
5.149
-0.975
-15.91%
1 Jan 2008 Jahr
5.333
+0.184
3.57%
1 Jan 2009 Jahr
4.693
-0.64
-12.0%
1 Jan 2010 Jahr
8.342
+3.649
77.74%
1 Jan 2011 Jahr
10.873
+2.531
30.34%
1 Jan 2012 Jahr
11.514
+0.641
5.9%
1 Jan 2013 Jahr
14.318
+2.804
24.35%
1 Jan 2014 Jahr
14.488
+0.17
1.19%
1 Jan 2015 Jahr
15.319
+0.831
5.73%
1 Jan 2016 Jahr
17.29
+1.971
12.87%
Bewertung der Länder gemäß mit laufender Statistik nach Jahren


Kommentare: