29
/de/
de
AIzaSyAYiBZKx7MnpbEhh9jyipgxe19OcubqV5w
April 1, 2024
32686
Europe & Central Asia (IDA & IBRD countries)
TEC
false
2
1
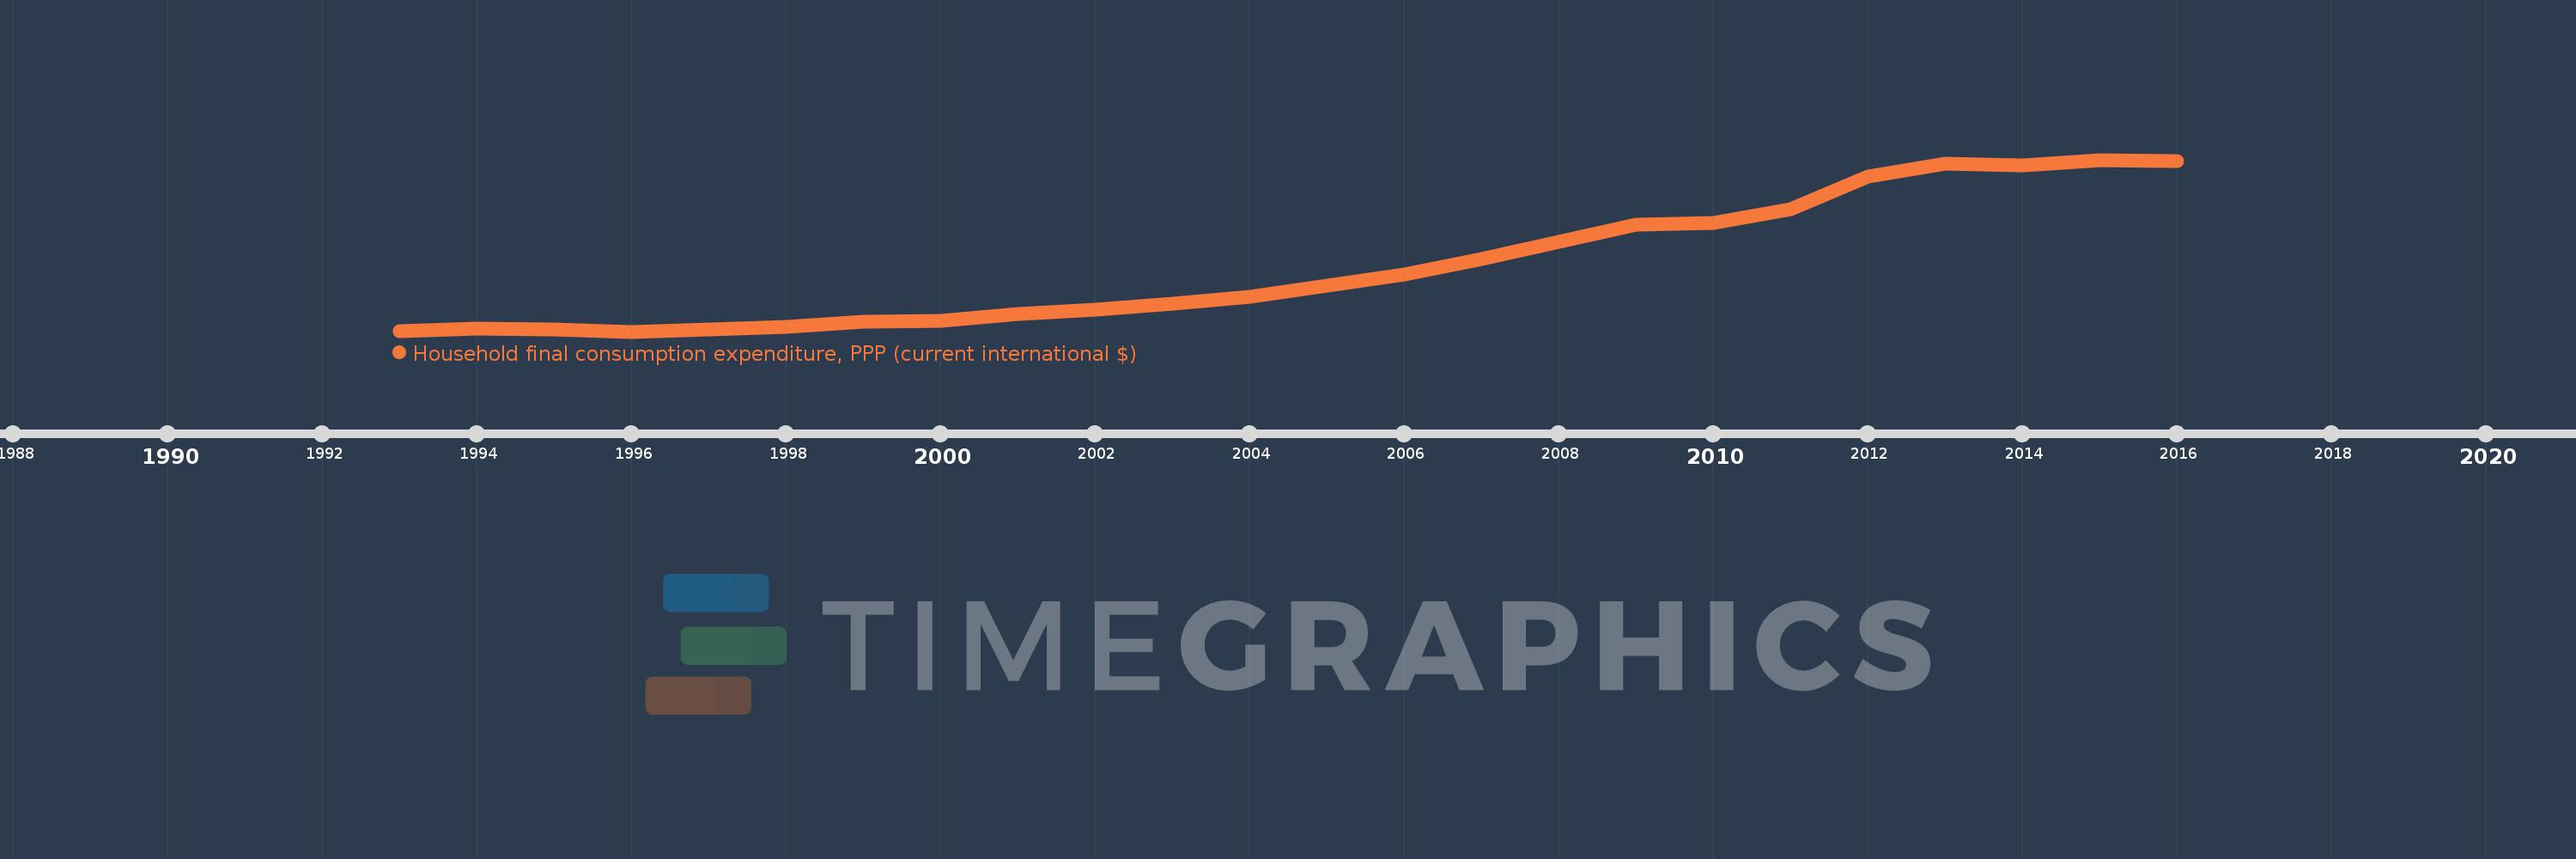
Household final consumption expenditure, PPP (current international $)
2016,2015,2014,2013,2012,2011,2010,2009,2008,2007,2006,2005,2004,2003,2002,2001,2000,1999,1998,1997,1996,1995,1994,1993
Diese Statistik in anderen Ländern:
AfghanistanAlbaniaAlgeriaAngolaAntigua and BarbudaArab WorldArgentinaArmeniaArubaAustraliaAustriaAzerbaijanBahamas, TheBahrainBangladeshBarbadosBelarusBelgiumBelizeBeninBermudaBhutanBoliviaBosnia and HerzegovinaBotswanaBrazilBrunei DarussalamBulgariaBurkina FasoBurundiCabo VerdeCambodiaCameroonCanadaCaribbean small statesCentral African RepublicCentral Europe and the BalticsChadChileChinaColombiaComorosCongo, Dem. Rep.Congo, Rep.Costa RicaCote d'IvoireCroatiaCubaCyprusCzech RepublicDenmarkDjiboutiDominicaDominican RepublicEarly-demographic dividendEast Asia & PacificEast Asia & Pacific (excluding high income)East Asia & Pacific (IDA & IBRD countries)EcuadorEgypt, Arab Rep.El SalvadorEquatorial GuineaEritreaEstoniaEthiopiaEuro areaEurope & Central AsiaEurope & Central Asia (excluding high income)Europe & Central Asia (IDA & IBRD countries)European UnionFijiFinlandFranceGabonGambia, TheGeorgiaGermanyGhanaGreeceGrenadaGuatemalaGuineaGuinea-BissauGuyanaHaitiHeavily indebted poor countries (HIPC)High incomeHondurasHong Kong SAR, ChinaHungaryIBRD onlyIcelandIDA & IBRD totalIDA blendIDA onlyIDA totalIndiaIndonesiaIran, Islamic Rep.IrelandIsraelItalyJamaicaJapanJordanKazakhstanKenyaKorea, Rep.KosovoKuwaitKyrgyz RepublicLao PDRLate-demographic dividendLatin America & Caribbean Latin America & Caribbean (excluding high income)Latin America & the Caribbean (IDA & IBRD countries)LatviaLeast developed countries: UN classificationLebanonLiberiaLibyaLithuaniaLow & middle incomeLow incomeLower middle incomeLuxembourgMacao SAR, ChinaMacedonia, FYRMadagascarMalawiMalaysiaMaliMaltaMauritaniaMauritiusMexicoMiddle East & North AfricaMiddle East & North Africa (excluding high income)Middle East & North Africa (IDA & IBRD countries)Middle incomeMoldovaMongoliaMontenegroMoroccoMozambiqueNamibiaNepalNetherlandsNew ZealandNicaraguaNigerNigeriaNorth AmericaNorwayOECD membersOmanOther small statesPakistanPanamaPapua New GuineaParaguayPeruPhilippinesPolandPortugalPost-demographic dividendPre-demographic dividendPuerto RicoQatarRomaniaRussian FederationRwandaSaudi ArabiaSenegalSerbiaSeychellesSierra LeoneSingaporeSlovak RepublicSloveniaSmall statesSolomon IslandsSouth AfricaSouth AsiaSouth Asia (IDA & IBRD)South SudanSpainSri LankaSt. Kitts and NevisSt. LuciaSt. Vincent and the GrenadinesSub-Saharan Africa Sub-Saharan Africa (excluding high income)Sub-Saharan Africa (IDA & IBRD countries)SudanSurinameSwazilandSwedenSwitzerlandSyrian Arab RepublicTajikistanTanzaniaThailandTimor-LesteTogoTongaTrinidad and TobagoTunisiaTurkeyTurkmenistanUgandaUkraineUnited Arab EmiratesUnited KingdomUnited StatesUpper middle incomeUruguayUzbekistanVanuatuVenezuela, RBVietnamWest Bank and GazaWorldYemen, Rep.ZambiaZimbabwe Zeitlinie:
Diese Zeitleiste vorliegt die Graphik ab 1993 J. bis 2016 J. Europe & Central Asia (IDA & IBRD countries). Die Angaben bis 1992 J. sind nicht vorhanden. Die Zahl aktueller Beobachtungen nach Daten: 24.
Die Quelle (Bezeichnung):
Kennzahlen der Weltentwicklung
Die Quelle (Einrichtung):
World Bank, International Comparison Program database.
Kategorien:
Economy & Growth
Es wurde aktualisiert:
23 Apr 2017 Jahr
Kennzahlen der Wertänderungen vom Jahr zum Jahr
im Durchschnitt:
2.406 Trln
Minimum:
1.067 Trln
1 Jan 1996 Jahr
Maximum:
4.578 Trln
1 Jan 2015 Jahr
Zum Datum der Beobachtung
Wert
Absolute Veränderung
Die Veränderung bezüglich dem vorherigen Wert
1 Jan 1993 Jahr
1.07 Trln
+1.07 Trln
0.0%
1 Jan 1994 Jahr
1.13 Trln
+59.41 Mlrd.
5.55%
1 Jan 1995 Jahr
1.118 Trln
-11.807 Mlrd.
-1.05%
1 Jan 1996 Jahr
1.067 Trln
-50.423 Mlrd.
-4.51%
1 Jan 1997 Jahr
1.109 Trln
+41.375 Mlrd.
3.88%
1 Jan 1998 Jahr
1.173 Trln
+63.867 Mlrd.
5.76%
1 Jan 1999 Jahr
1.269 Trln
+96.113 Mlrd.
8.2%
1 Jan 2000 Jahr
1.288 Trln
+18.958 Mlrd.
1.49%
1 Jan 2001 Jahr
1.427 Trln
+139.341 Mlrd.
10.82%
1 Jan 2002 Jahr
1.521 Trln
+94.387 Mlrd.
6.61%
1 Jan 2003 Jahr
1.642 Trln
+120.749 Mlrd.
7.94%
1 Jan 2004 Jahr
1.772 Trln
+129.709 Mlrd.
7.9%
1 Jan 2005 Jahr
2.015 Trln
+243.274 Mlrd.
13.73%
1 Jan 2006 Jahr
2.228 Trln
+213.048 Mlrd.
10.57%
1 Jan 2007 Jahr
2.556 Trln
+327.417 Mlrd.
14.69%
1 Jan 2008 Jahr
2.908 Trln
+352.348 Mlrd.
13.79%
1 Jan 2009 Jahr
3.257 Trln
+349.079 Mlrd.
12.0%
1 Jan 2010 Jahr
3.288 Trln
+31.214 Mlrd.
0.96%
1 Jan 2011 Jahr
3.576 Trln
+288.097 Mlrd.
8.76%
1 Jan 2012 Jahr
4.228 Trln
+652.005 Mlrd.
18.23%
1 Jan 2013 Jahr
4.501 Trln
+273.128 Mlrd.
6.46%
1 Jan 2014 Jahr
4.473 Trln
-28.39 Mlrd.
-0.63%
1 Jan 2015 Jahr
4.578 Trln
+105.42 Mlrd.
2.36%
1 Jan 2016 Jahr
4.549 Trln
-29.228 Mlrd.
-0.64%
Bewertung der Länder gemäß mit laufender Statistik nach Jahren


Kommentare: