29
/de/
de
AIzaSyAYiBZKx7MnpbEhh9jyipgxe19OcubqV5w
April 1, 2024
32020
Europe & Central Asia (excluding high income)
ECA
false
2
1
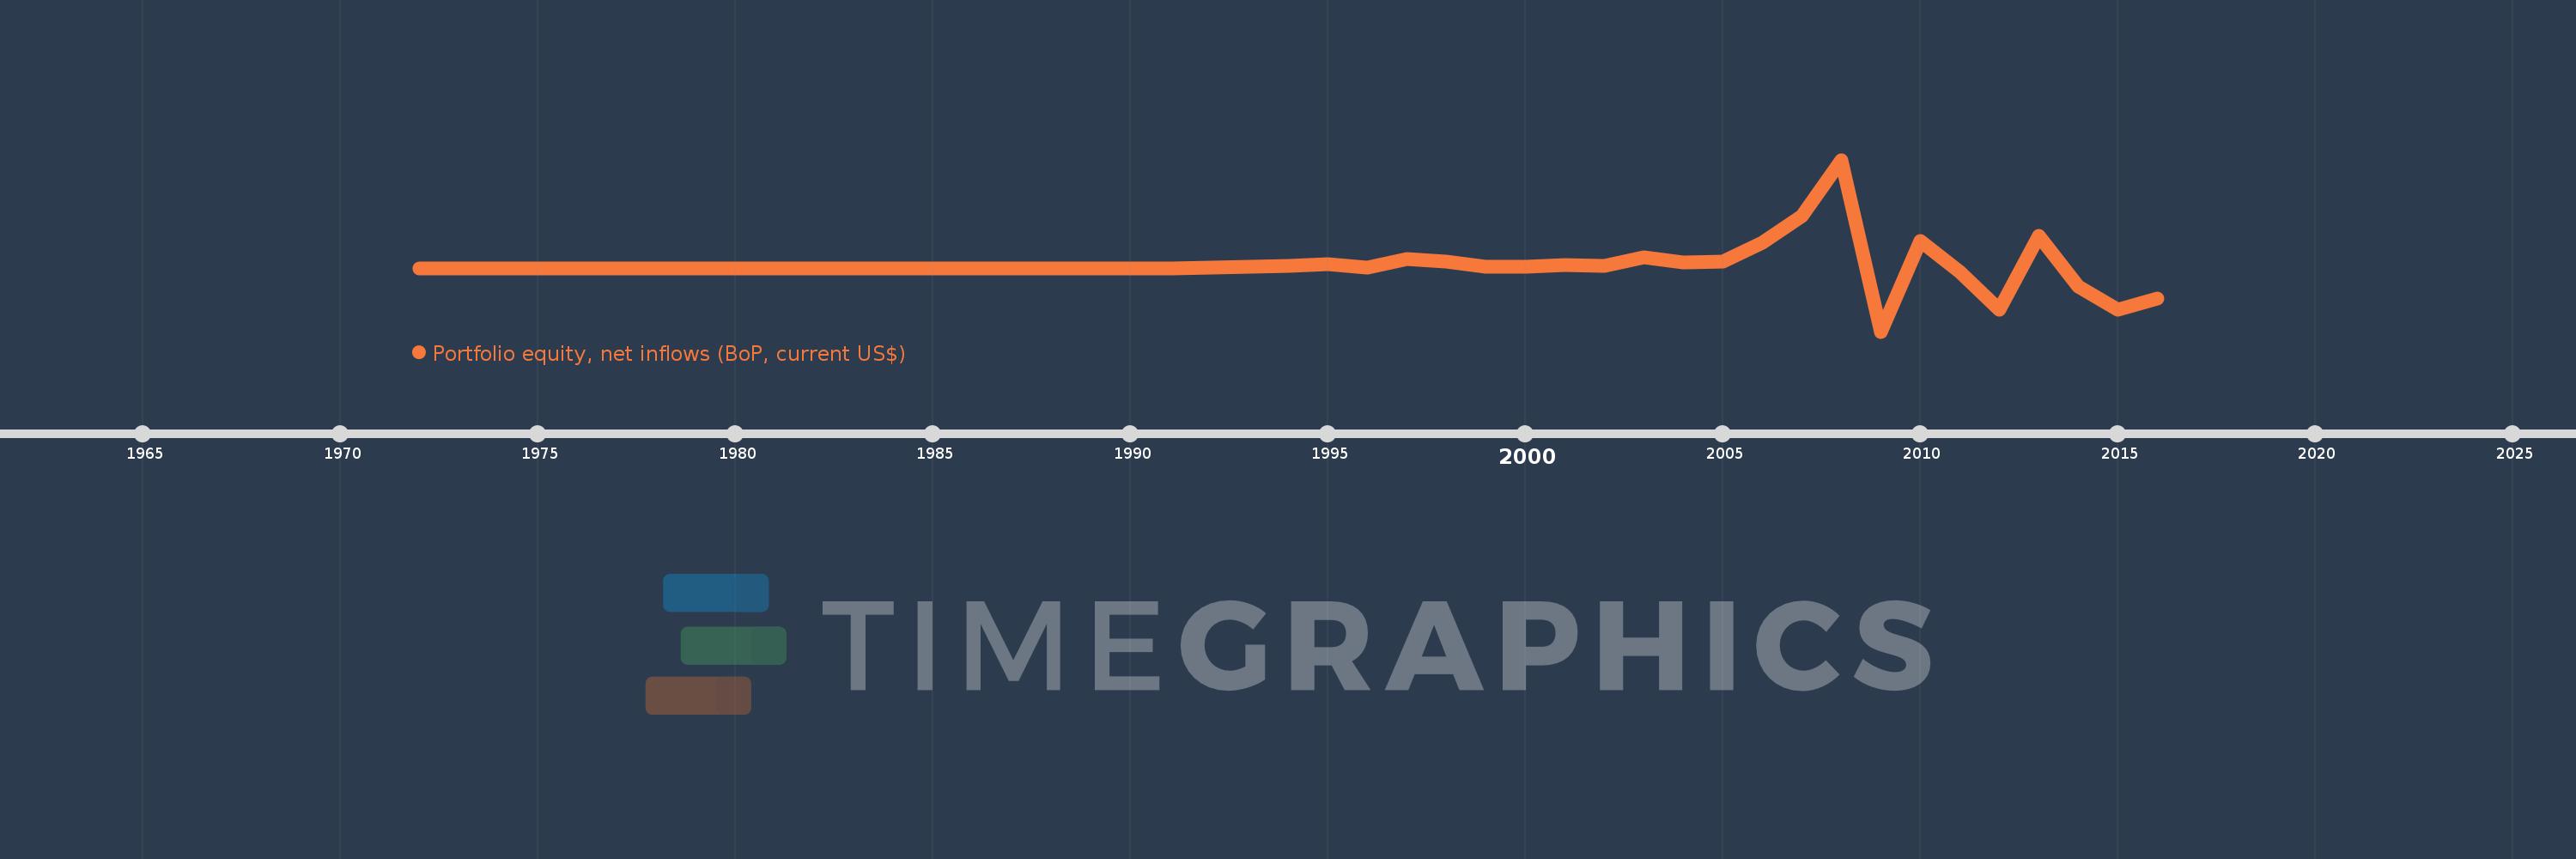
Portfolio equity, net inflows (BoP, current US$)
2016,2015,2014,2013,2012,2011,2010,2009,2008,2007,2006,2005,2004,2003,2002,2001,2000,1999,1998,1997,1996,1995,1994,1993,1992,1991,1990,1989,1988,1987,1986,1985,1984,1983,1982,1981,1980,1979,1978,1977,1976,1975,1974,1973,1972
Diese Statistik in anderen Ländern:
AfghanistanAlbaniaAlgeriaAngolaAntigua and BarbudaArab WorldArgentinaArmeniaArubaAustraliaAustriaAzerbaijanBahamas, TheBahrainBangladeshBarbadosBelarusBelgiumBelizeBeninBermudaBhutanBoliviaBosnia and HerzegovinaBotswanaBrazilBulgariaBurkina FasoBurundiCabo VerdeCambodiaCameroonCanadaCaribbean small statesCentral African RepublicCentral Europe and the BalticsChadChileChinaColombiaComorosCongo, Dem. Rep.Congo, Rep.Costa RicaCote d'IvoireCroatiaCuracaoCyprusCzech RepublicDenmarkDjiboutiDominicaDominican RepublicEarly-demographic dividendEast Asia & PacificEast Asia & Pacific (excluding high income)East Asia & Pacific (IDA & IBRD countries)EcuadorEgypt, Arab Rep.El SalvadorEquatorial GuineaEstoniaEthiopiaEuro areaEurope & Central AsiaEurope & Central Asia (excluding high income)Europe & Central Asia (IDA & IBRD countries)European UnionFijiFinlandFragile and conflict affected situationsFranceFrench PolynesiaGabonGambia, TheGeorgiaGermanyGhanaGreeceGrenadaGuatemalaGuineaGuinea-BissauGuyanaHaitiHeavily indebted poor countries (HIPC)High incomeHondurasHong Kong SAR, ChinaHungaryIBRD onlyIcelandIDA & IBRD totalIDA blendIDA onlyIDA totalIndiaIndonesiaIran, Islamic Rep.IraqIrelandIsraelItalyJamaicaJapanJordanKazakhstanKenyaKiribatiKorea, Rep.KosovoKuwaitKyrgyz RepublicLao PDRLate-demographic dividendLatin America & Caribbean Latin America & Caribbean (excluding high income)Latin America & the Caribbean (IDA & IBRD countries)LatviaLeast developed countries: UN classificationLebanonLesothoLiberiaLibyaLithuaniaLow & middle incomeLow incomeLower middle incomeLuxembourgMacao SAR, ChinaMacedonia, FYRMadagascarMalawiMalaysiaMaldivesMaliMaltaMarshall IslandsMauritaniaMauritiusMexicoMiddle East & North AfricaMiddle East & North Africa (excluding high income)Middle East & North Africa (IDA & IBRD countries)Middle incomeMoldovaMongoliaMontenegroMoroccoMozambiqueMyanmarNamibiaNepalNetherlandsNew CaledoniaNew ZealandNicaraguaNigerNigeriaNorth AmericaNorwayOECD membersOmanOther small statesPacific island small statesPakistanPanamaPapua New GuineaParaguayPeruPhilippinesPolandPortugalPost-demographic dividendPre-demographic dividendQatarRomaniaRussian FederationRwandaSamoaSao Tome and PrincipeSaudi ArabiaSenegalSerbiaSeychellesSierra LeoneSingaporeSlovak RepublicSloveniaSmall statesSolomon IslandsSomaliaSouth AfricaSouth AsiaSouth Asia (IDA & IBRD)SpainSri LankaSt. Kitts and NevisSt. LuciaSt. Vincent and the GrenadinesSub-Saharan Africa Sub-Saharan Africa (excluding high income)Sub-Saharan Africa (IDA & IBRD countries)SudanSurinameSwazilandSwedenSwitzerlandSyrian Arab RepublicTajikistanTanzaniaThailandTimor-LesteTogoTongaTrinidad and TobagoTunisiaTurkeyUgandaUkraineUnited KingdomUnited StatesUpper middle incomeUruguayVanuatuVenezuela, RBVietnamWest Bank and GazaWorldYemen, Rep.ZambiaZimbabwe Zeitlinie:
Diese Zeitleiste vorliegt die Graphik ab 1972 J. bis 2016 J. Europe & Central Asia (excluding high income). Die Angaben bis 1971 J. sind nicht vorhanden. Die Zahl aktueller Beobachtungen nach Daten: 45.
Die Quelle (Bezeichnung):
Kennzahlen der Weltentwicklung
Die Quelle (Einrichtung):
International Monetary Fund, Balance of Payments database, and World Bank, International Debt Statistics.
Kategorien:
Economy & Growth, Financial Sector, External Debt
Es wurde aktualisiert:
23 Apr 2017 Jahr
Kennzahlen der Wertänderungen vom Jahr zum Jahr
im Durchschnitt:
606.233 Mln.
Minimum:
-15.595 Mlrd.
1 Jan 2009 Jahr
Maximum:
26.894 Mlrd.
1 Jan 2008 Jahr
Zum Datum der Beobachtung
Wert
Absolute Veränderung
Die Veränderung bezüglich dem vorherigen Wert
1 Jan 1972 Jahr
0.0
0.0
0.0%
1 Jan 1990 Jahr
17.0 Mln.
+17.0 Mln.
%
1 Jan 1991 Jahr
89.0 Mln.
+72.0 Mln.
423.53%
1 Jan 1992 Jahr
147.0 Mln.
+58.0 Mln.
65.17%
1 Jan 1993 Jahr
350.0 Mln.
+203.0 Mln.
138.1%
1 Jan 1994 Jahr
570.0 Mln.
+220.0 Mln.
62.86%
1 Jan 1995 Jahr
1.034 Mlrd.
+464.408 Mln.
81.48%
1 Jan 1996 Jahr
241.569 Mln.
-792.839 Mln.
-76.65%
1 Jan 1997 Jahr
2.395 Mlrd.
+2.153 Mlrd.
891.29%
1 Jan 1998 Jahr
1.779 Mlrd.
-615.77 Mln.
-25.71%
1 Jan 1999 Jahr
547.171 Mln.
-1.232 Mlrd.
-69.24%
1 Jan 2000 Jahr
351.395 Mln.
-195.776 Mln.
-35.78%
1 Jan 2001 Jahr
871.194 Mln.
+519.8 Mln.
147.92%
1 Jan 2002 Jahr
611.02 Mln.
-260.174 Mln.
-29.86%
1 Jan 2003 Jahr
2.737 Mlrd.
+2.126 Mlrd.
347.97%
1 Jan 2004 Jahr
1.533 Mlrd.
-1.205 Mlrd.
-44.01%
1 Jan 2005 Jahr
1.77 Mlrd.
+237.17 Mln.
15.48%
1 Jan 2006 Jahr
6.476 Mlrd.
+4.707 Mlrd.
265.95%
1 Jan 2007 Jahr
12.964 Mlrd.
+6.488 Mlrd.
100.18%
1 Jan 2008 Jahr
26.894 Mlrd.
+13.929 Mlrd.
107.44%
1 Jan 2009 Jahr
-15.595 Mlrd.
-42.488 Mlrd.
-157.99%
1 Jan 2010 Jahr
6.757 Mlrd.
+22.352 Mlrd.
-143.33%
1 Jan 2011 Jahr
-930.281 Mln.
-7.688 Mlrd.
-113.77%
1 Jan 2012 Jahr
-10.263 Mlrd.
-9.332 Mlrd.
1.0 Tsnd.%
1 Jan 2013 Jahr
8.024 Mlrd.
+18.286 Mlrd.
-178.18%
1 Jan 2014 Jahr
-4.491 Mlrd.
-12.514 Mlrd.
-155.97%
1 Jan 2015 Jahr
-10.219 Mlrd.
-5.728 Mlrd.
127.56%
1 Jan 2016 Jahr
-7.38 Mlrd.
+2.839 Mlrd.
-27.78%
Bewertung der Länder gemäß mit laufender Statistik nach Jahren


Kommentare: