29
/de/
de
AIzaSyAYiBZKx7MnpbEhh9jyipgxe19OcubqV5w
April 1, 2024
30753
Europe & Central Asia
ECS
false
2
1
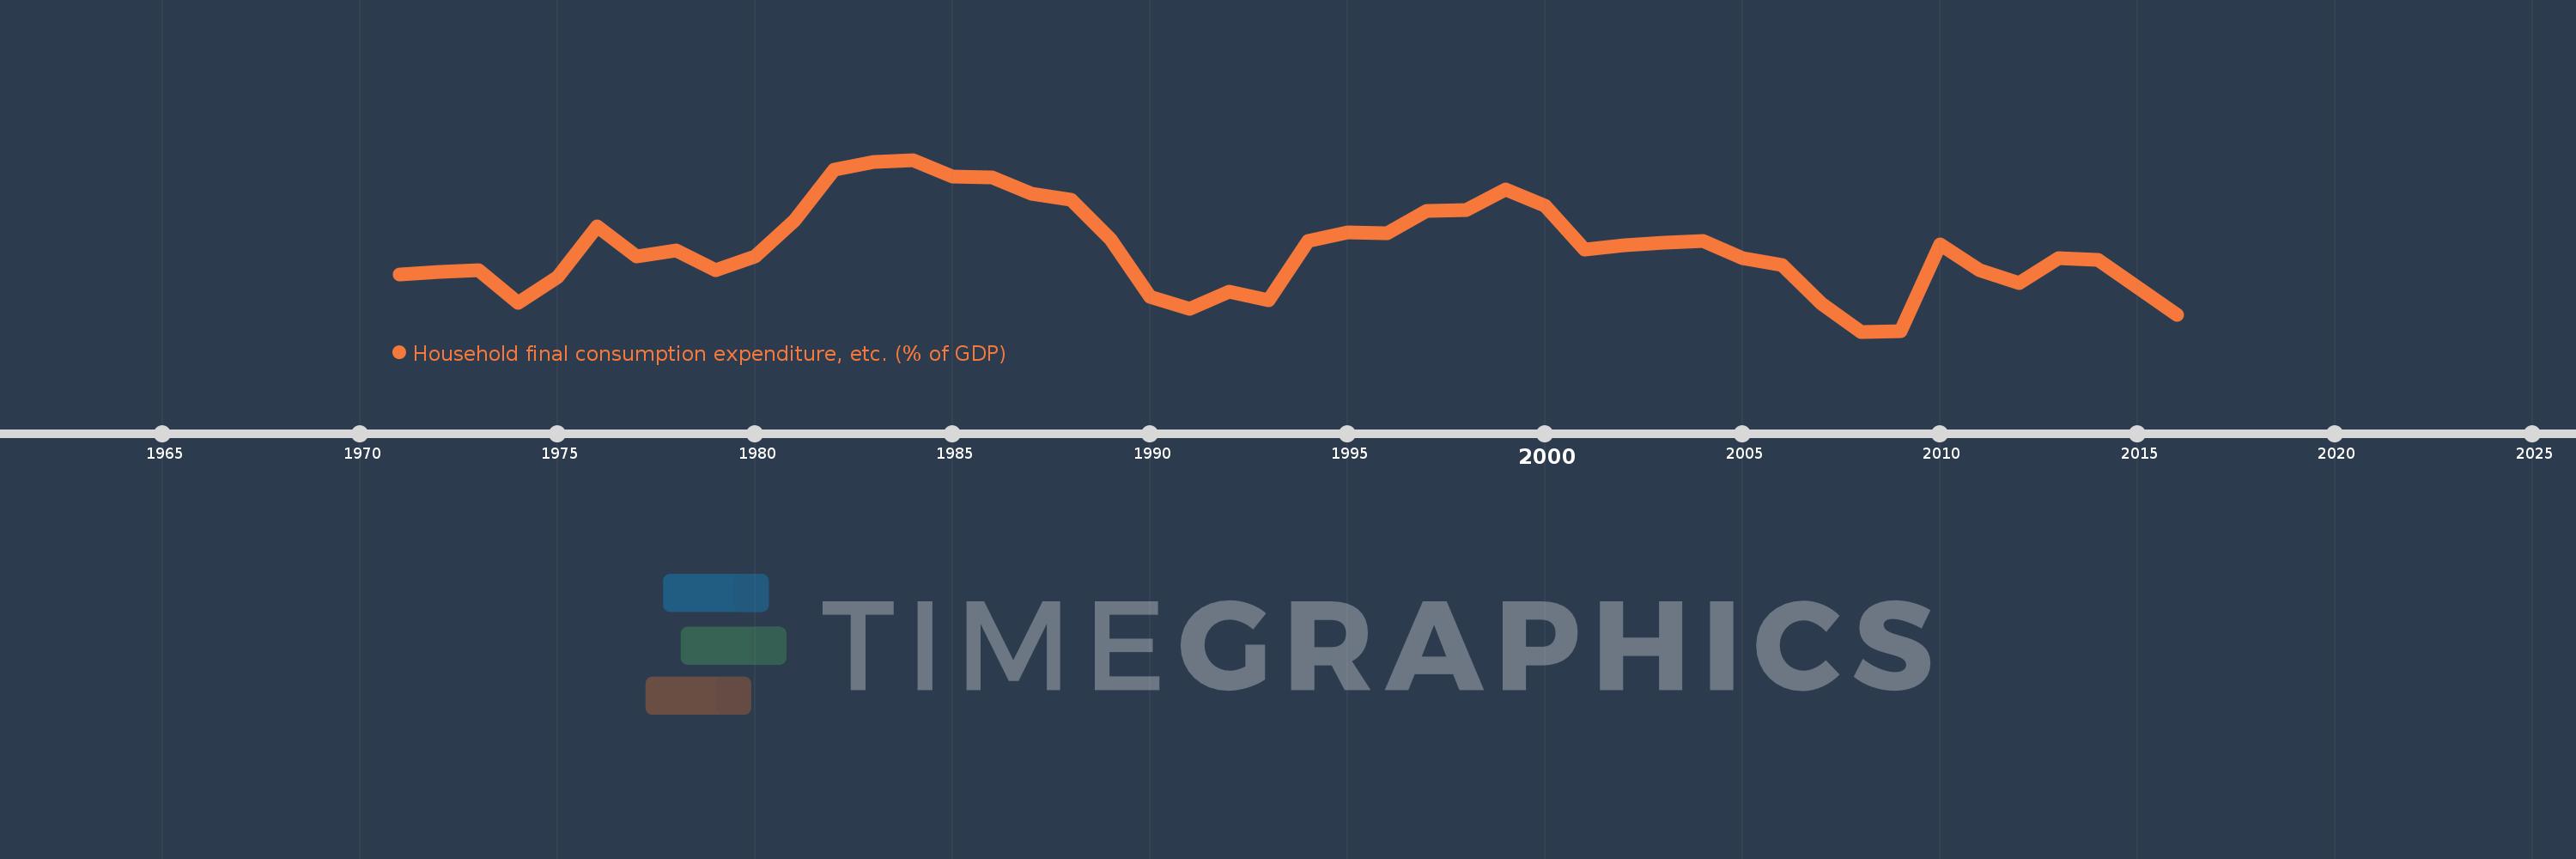
Household final consumption expenditure, etc. (% of GDP)
2016,2015,2014,2013,2012,2011,2010,2009,2008,2007,2006,2005,2004,2003,2002,2001,2000,1999,1998,1997,1996,1995,1994,1993,1992,1991,1990,1989,1988,1987,1986,1985,1984,1983,1982,1981,1980,1979,1978,1977,1976,1975,1974,1973,1972,1971
Diese Statistik in anderen Ländern:
AfghanistanAlbaniaAlgeriaAngolaAntigua and BarbudaArab WorldArgentinaArmeniaArubaAustraliaAustriaAzerbaijanBahamas, TheBahrainBangladeshBarbadosBelarusBelgiumBelizeBeninBermudaBhutanBoliviaBosnia and HerzegovinaBotswanaBrazilBrunei DarussalamBulgariaBurkina FasoBurundiCabo VerdeCambodiaCameroonCanadaCaribbean small statesCentral African RepublicCentral Europe and the BalticsChadChileChinaColombiaComorosCongo, Dem. Rep.Congo, Rep.Costa RicaCote d'IvoireCroatiaCubaCyprusCzech RepublicDenmarkDjiboutiDominicaDominican RepublicEarly-demographic dividendEast Asia & PacificEast Asia & Pacific (excluding high income)East Asia & Pacific (IDA & IBRD countries)EcuadorEgypt, Arab Rep.El SalvadorEquatorial GuineaEritreaEstoniaEthiopiaEuro areaEurope & Central AsiaEurope & Central Asia (excluding high income)Europe & Central Asia (IDA & IBRD countries)European UnionFaroe IslandsFijiFinlandFragile and conflict affected situationsFranceGabonGambia, TheGeorgiaGermanyGhanaGreeceGrenadaGuatemalaGuineaGuinea-BissauGuyanaHaitiHeavily indebted poor countries (HIPC)High incomeHondurasHong Kong SAR, ChinaHungaryIBRD onlyIcelandIDA & IBRD totalIDA blendIDA onlyIDA totalIndiaIndonesiaIran, Islamic Rep.IraqIrelandIsraelItalyJamaicaJapanJordanKazakhstanKenyaKiribatiKorea, Rep.KosovoKuwaitKyrgyz RepublicLao PDRLate-demographic dividendLatin America & Caribbean Latin America & Caribbean (excluding high income)Latin America & the Caribbean (IDA & IBRD countries)LatviaLeast developed countries: UN classificationLebanonLesothoLiberiaLibyaLithuaniaLow & middle incomeLow incomeLower middle incomeLuxembourgMacao SAR, ChinaMacedonia, FYRMadagascarMalawiMalaysiaMaldivesMaliMaltaMauritaniaMauritiusMexicoMicronesia, Fed. Sts.Middle East & North AfricaMiddle East & North Africa (excluding high income)Middle East & North Africa (IDA & IBRD countries)Middle incomeMoldovaMongoliaMontenegroMoroccoMozambiqueNamibiaNepalNetherlandsNew CaledoniaNew ZealandNicaraguaNigerNigeriaNorth AmericaNorwayOECD membersOmanOther small statesPacific island small statesPakistanPanamaPapua New GuineaParaguayPeruPhilippinesPolandPortugalPost-demographic dividendPre-demographic dividendPuerto RicoQatarRomaniaRussian FederationRwandaSaudi ArabiaSenegalSerbiaSeychellesSierra LeoneSingaporeSlovak RepublicSloveniaSmall statesSolomon IslandsSomaliaSouth AfricaSouth AsiaSouth Asia (IDA & IBRD)South SudanSpainSri LankaSt. Kitts and NevisSt. LuciaSt. Vincent and the GrenadinesSub-Saharan Africa Sub-Saharan Africa (excluding high income)Sub-Saharan Africa (IDA & IBRD countries)SudanSurinameSwazilandSwedenSwitzerlandSyrian Arab RepublicTajikistanTanzaniaThailandTimor-LesteTogoTongaTrinidad and TobagoTunisiaTurkeyTurkmenistanUgandaUkraineUnited Arab EmiratesUnited KingdomUnited StatesUpper middle incomeUruguayUzbekistanVanuatuVenezuela, RBVietnamWest Bank and GazaWorldYemen, Rep.ZambiaZimbabwe Zeitlinie:
Diese Zeitleiste vorliegt die Graphik ab 1971 J. bis 2016 J. Europe & Central Asia. Die Angaben bis 1970 J. sind nicht vorhanden. Die Zahl aktueller Beobachtungen nach Daten: 46.
Die Quelle (Bezeichnung):
Kennzahlen der Weltentwicklung
Die Quelle (Einrichtung):
World Bank national accounts data, and OECD National Accounts data files.
Kategorien:
Economy & Growth
Es wurde aktualisiert:
23 Apr 2017 Jahr
Kennzahlen der Wertänderungen vom Jahr zum Jahr
Minimum:
56.013
1 Jan 2008 Jahr
Maximum:
58.695
1 Jan 1984 Jahr
Zum Datum der Beobachtung
Wert
Absolute Veränderung
Die Veränderung bezüglich dem vorherigen Wert
1 Jan 1971 Jahr
56.908
+56.908
0.0%
1 Jan 1972 Jahr
56.945
+0.037
0.06%
1 Jan 1973 Jahr
56.97
+0.025
0.04%
1 Jan 1974 Jahr
56.468
-0.503
-0.88%
1 Jan 1975 Jahr
56.867
+0.4
0.71%
1 Jan 1976 Jahr
57.662
+0.794
1.4%
1 Jan 1977 Jahr
57.19
-0.472
-0.82%
1 Jan 1978 Jahr
57.284
+0.095
0.17%
1 Jan 1979 Jahr
56.97
-0.315
-0.55%
1 Jan 1980 Jahr
57.193
+0.224
0.39%
1 Jan 1981 Jahr
57.751
+0.557
0.97%
1 Jan 1982 Jahr
58.539
+0.789
1.37%
1 Jan 1983 Jahr
58.663
+0.123
0.21%
1 Jan 1984 Jahr
58.695
+0.032
0.05%
1 Jan 1985 Jahr
58.434
-0.261
-0.44%
1 Jan 1986 Jahr
58.419
-0.015
-0.03%
1 Jan 1987 Jahr
58.168
-0.251
-0.43%
1 Jan 1988 Jahr
58.077
-0.09
-0.16%
1 Jan 1989 Jahr
57.457
-0.621
-1.07%
1 Jan 1990 Jahr
56.562
-0.894
-1.56%
1 Jan 1991 Jahr
56.363
-0.199
-0.35%
1 Jan 1992 Jahr
56.642
+0.279
0.49%
1 Jan 1993 Jahr
56.507
-0.135
-0.24%
1 Jan 1994 Jahr
57.43
+0.924
1.63%
1 Jan 1995 Jahr
57.565
+0.135
0.24%
1 Jan 1996 Jahr
57.551
-0.015
-0.03%
1 Jan 1997 Jahr
57.901
+0.35
0.61%
1 Jan 1998 Jahr
57.907
+0.006
0.01%
1 Jan 1999 Jahr
58.227
+0.32
0.55%
1 Jan 2000 Jahr
57.971
-0.256
-0.44%
1 Jan 2001 Jahr
57.298
-0.673
-1.16%
1 Jan 2002 Jahr
57.367
+0.068
0.12%
1 Jan 2003 Jahr
57.404
+0.037
0.07%
1 Jan 2004 Jahr
57.424
+0.019
0.03%
1 Jan 2005 Jahr
57.161
-0.263
-0.46%
1 Jan 2006 Jahr
57.05
-0.111
-0.19%
1 Jan 2007 Jahr
56.443
-0.606
-1.06%
1 Jan 2008 Jahr
56.013
-0.43
-0.76%
1 Jan 2009 Jahr
56.024
+0.011
0.02%
1 Jan 2010 Jahr
57.368
+1.343
2.4%
1 Jan 2011 Jahr
56.977
-0.39
-0.68%
1 Jan 2012 Jahr
56.77
-0.208
-0.36%
1 Jan 2013 Jahr
57.153
+0.383
0.68%
1 Jan 2014 Jahr
57.134
-0.019
-0.03%
1 Jan 2015 Jahr
56.709
-0.425
-0.74%
1 Jan 2016 Jahr
56.277
-0.432
-0.76%
Bewertung der Länder gemäß mit laufender Statistik nach Jahren


Kommentare: