30
/de/
AIzaSyAYiBZKx7MnpbEhh9jyipgxe19OcubqV5w
April 1, 2024
30653
Europe & Central Asia
ECS
false
2
1
Firms that do not report all sales for tax purposes (% of firms)
2008,2006,2005,2004,2003
Download
Bibliothek der Globalstatistik →Europe & Central Asia →

Firms that do not report all sales for tax purposes (% of firms)

Diese Statistik in anderen Ländern:

AlbaniaAlgeriaAngolaArab WorldArgentinaArmeniaAzerbaijanBelarusBeninBoliviaBosnia and HerzegovinaBotswanaBulgariaBurkina FasoBurundiCabo VerdeCambodiaCameroonCaribbean small statesCentral Europe and the BalticsChileChinaColombiaCongo, Dem. Rep.Congo, Rep.Costa RicaCote d'IvoireCroatiaCzech RepublicDominican RepublicEarly-demographic dividendEast Asia & PacificEast Asia & Pacific (excluding high income)East Asia & Pacific (IDA & IBRD countries)EcuadorEgypt, Arab Rep.El SalvadorEstoniaEthiopiaEuro areaEurope & Central AsiaEurope & Central Asia (excluding high income)Europe & Central Asia (IDA & IBRD countries)European UnionFragile and conflict affected situationsGabonGambia, TheGeorgiaGhanaGreeceGuatemalaGuineaGuinea-BissauGuyanaHeavily indebted poor countries (HIPC)High incomeHondurasHungaryIBRD onlyIDA & IBRD totalIDA blendIDA onlyIDA totalIndiaIndonesiaIrelandJamaicaJordanKazakhstanKenyaKorea, Rep.Kyrgyz RepublicLao PDRLate-demographic dividendLatin America & Caribbean Latin America & Caribbean (excluding high income)Latin America & the Caribbean (IDA & IBRD countries)LatviaLeast developed countries: UN classificationLebanonLiberiaLithuaniaLow & middle incomeLow incomeLower middle incomeMacedonia, FYRMadagascarMalawiMaliMauritaniaMauritiusMexicoMiddle East & North AfricaMiddle East & North Africa (excluding high income)Middle East & North Africa (IDA & IBRD countries)Middle incomeMoldovaMongoliaMontenegroMozambiqueNamibiaNicaraguaNigerNigeriaOECD membersOmanOther small statesPakistanPanamaParaguayPeruPolandPortugalPost-demographic dividendPre-demographic dividendRomaniaRussian FederationRwandaSenegalSerbiaSierra LeoneSlovak RepublicSloveniaSmall statesSouth AfricaSouth AsiaSouth Asia (IDA & IBRD)SpainSri LankaSub-Saharan Africa Sub-Saharan Africa (excluding high income)Sub-Saharan Africa (IDA & IBRD countries)SwazilandSyrian Arab RepublicTajikistanTanzaniaTurkeyUgandaUkraineUpper middle incomeUruguayUzbekistanVietnamWest Bank and GazaWorldYemen, Rep.Zambia

Zeitlinie:

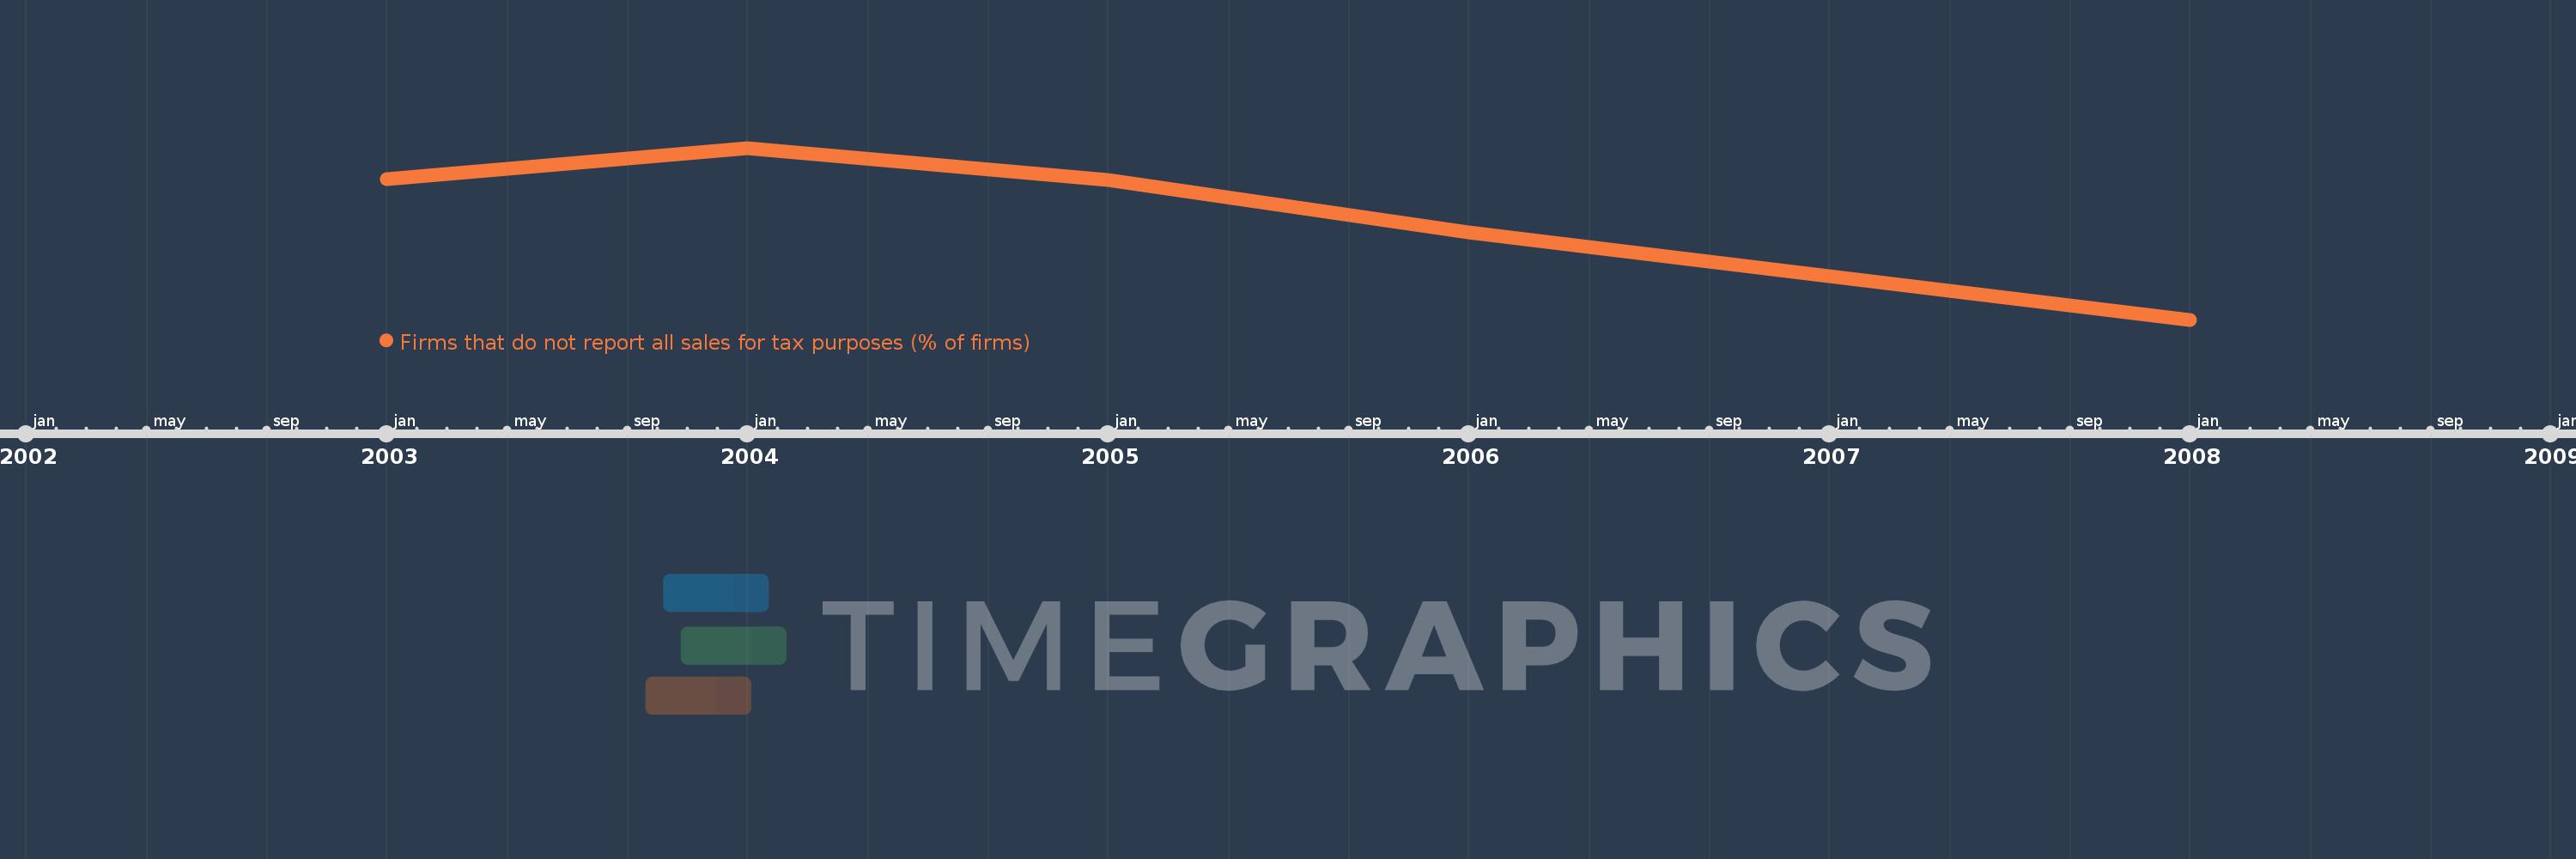
Diese Zeitleiste vorliegt die Graphik ab 2003 J. bis 2008 J. Europe & Central Asia. Die Angaben bis 2002 J. sind nicht vorhanden. Die Zahl aktueller Beobachtungen nach Daten: 5.

Die Quelle (Bezeichnung):

Kennzahlen der Weltentwicklung

Die Quelle (Einrichtung):

World Bank, Enterprise Surveys (http://www.enterprisesurveys.org/).

Kategorien:

Private Sector

Es wurde aktualisiert:

23 Apr 2017 Jahr

Kennzahlen der Wertänderungen vom Jahr zum Jahr

im Durchschnitt:
42.251
Minimum:
16.38
1 Jan 2008 Jahr
Maximum:
57.587
1 Jan 2004 Jahr
Zum Datum der Beobachtung
Wert
Absolute Veränderung
Die Veränderung bezüglich dem vorherigen Wert
1 Jan 2003 Jahr
50.03
+50.03
0.0%
1 Jan 2004 Jahr
57.587
+7.558
15.11%
1 Jan 2005 Jahr
49.875
-7.712
-13.39%
1 Jan 2006 Jahr
37.385
-12.49
-25.04%
1 Jan 2008 Jahr
16.38
-21.005
-56.19%

Bewertung der Länder gemäß mit laufender Statistik nach Jahren