29
/de/
de
AIzaSyAYiBZKx7MnpbEhh9jyipgxe19OcubqV5w
April 1, 2024
30162
Euro area
EMU
false
2
1
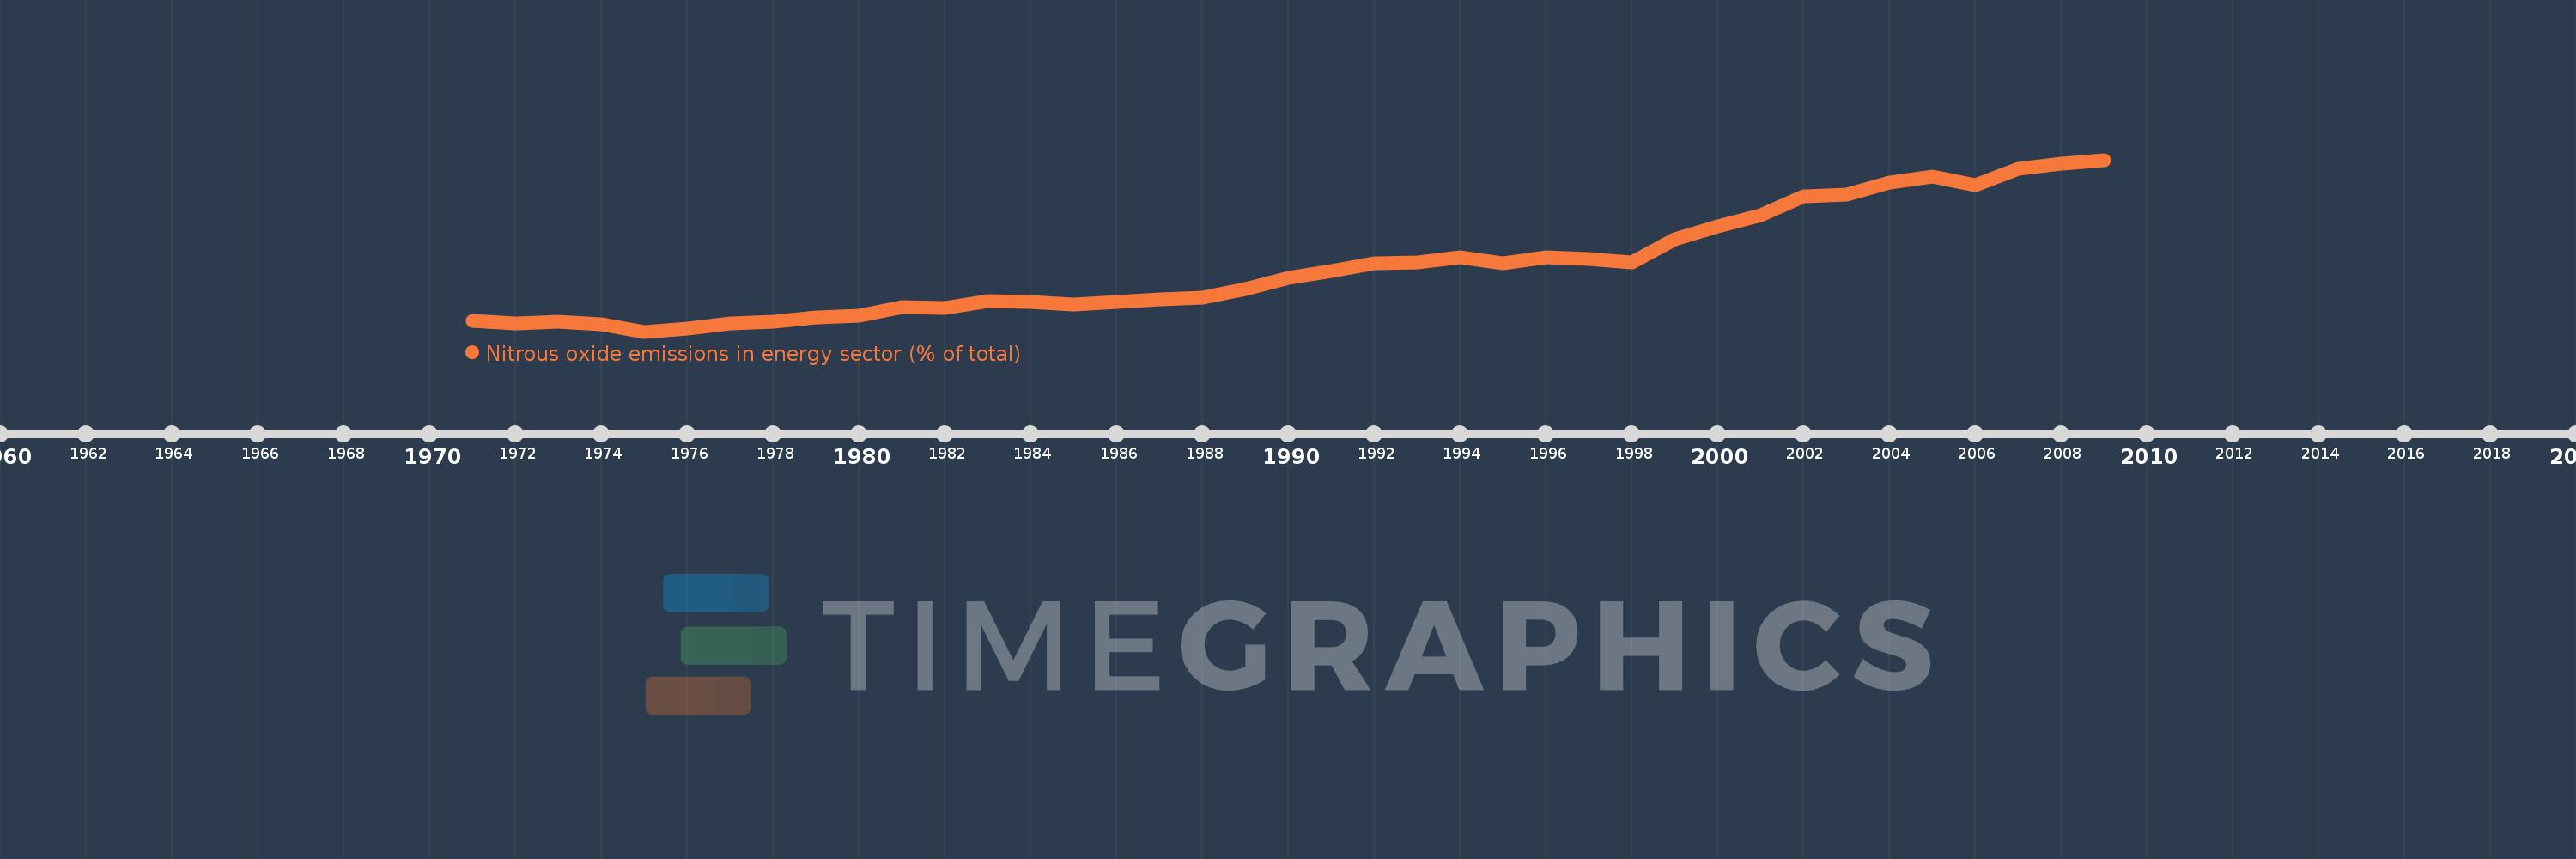
Nitrous oxide emissions in energy sector (% of total)
2009,2008,2007,2006,2005,2004,2003,2002,2001,2000,1999,1998,1997,1996,1995,1994,1993,1992,1991,1990,1989,1988,1987,1986,1985,1984,1983,1982,1981,1980,1979,1978,1977,1976,1975,1974,1973,1972,1971
Diese Statistik in anderen Ländern:
AfghanistanAlbaniaAlgeriaAmerican SamoaAndorraAngolaAntigua and BarbudaArab WorldArgentinaArmeniaArubaAustraliaAustriaAzerbaijanBahamas, TheBahrainBangladeshBarbadosBelarusBelgiumBelizeBeninBermudaBhutanBoliviaBosnia and HerzegovinaBotswanaBrazilBritish Virgin IslandsBrunei DarussalamBulgariaBurkina FasoBurundiCabo VerdeCambodiaCameroonCanadaCaribbean small statesCayman IslandsCentral African RepublicCentral Europe and the BalticsChadChileChinaColombiaComorosCongo, Dem. Rep.Congo, Rep.Costa RicaCote d'IvoireCroatiaCubaCyprusCzech RepublicDenmarkDjiboutiDominicaDominican RepublicEarly-demographic dividendEast Asia & PacificEast Asia & Pacific (excluding high income)East Asia & Pacific (IDA & IBRD countries)EcuadorEgypt, Arab Rep.El SalvadorEquatorial GuineaEritreaEstoniaEthiopiaEuro areaEurope & Central AsiaEurope & Central Asia (excluding high income)Europe & Central Asia (IDA & IBRD countries)European UnionFaroe IslandsFijiFinlandFragile and conflict affected situationsFranceFrench PolynesiaGabonGambia, TheGeorgiaGermanyGhanaGibraltarGreeceGreenlandGrenadaGuamGuatemalaGuineaGuinea-BissauGuyanaHaitiHeavily indebted poor countries (HIPC)High incomeHondurasHong Kong SAR, ChinaHungaryIBRD onlyIcelandIDA & IBRD totalIDA blendIDA onlyIDA totalIndiaIndonesiaIran, Islamic Rep.IraqIrelandIsraelItalyJamaicaJapanJordanKazakhstanKenyaKiribatiKorea, Dem. People’s Rep.Korea, Rep.KuwaitKyrgyz RepublicLao PDRLate-demographic dividendLatin America & Caribbean Latin America & Caribbean (excluding high income)Latin America & the Caribbean (IDA & IBRD countries)LatviaLeast developed countries: UN classificationLebanonLesothoLiberiaLibyaLithuaniaLow & middle incomeLow incomeLower middle incomeLuxembourgMacao SAR, ChinaMacedonia, FYRMadagascarMalawiMalaysiaMaldivesMaliMaltaMarshall IslandsMauritaniaMauritiusMexicoMicronesia, Fed. Sts.Middle East & North AfricaMiddle East & North Africa (excluding high income)Middle East & North Africa (IDA & IBRD countries)Middle incomeMoldovaMongoliaMoroccoMozambiqueMyanmarNamibiaNauruNepalNetherlandsNew CaledoniaNew ZealandNicaraguaNigerNigeriaNorth AmericaNorthern Mariana IslandsNorwayOECD membersOmanOther small statesPacific island small statesPakistanPalauPanamaPapua New GuineaParaguayPeruPhilippinesPolandPortugalPost-demographic dividendPre-demographic dividendPuerto RicoQatarRomaniaRussian FederationRwandaSamoaSao Tome and PrincipeSaudi ArabiaSenegalSerbiaSeychellesSierra LeoneSingaporeSlovak RepublicSloveniaSmall statesSolomon IslandsSomaliaSouth AfricaSouth AsiaSouth Asia (IDA & IBRD)SpainSri LankaSt. Kitts and NevisSt. LuciaSt. Vincent and the GrenadinesSub-Saharan Africa Sub-Saharan Africa (excluding high income)Sub-Saharan Africa (IDA & IBRD countries)SudanSurinameSwazilandSwedenSwitzerlandSyrian Arab RepublicTajikistanTanzaniaThailandTimor-LesteTogoTongaTrinidad and TobagoTunisiaTurkeyTurkmenistanTurks and Caicos IslandsTuvaluUgandaUkraineUnited Arab EmiratesUnited KingdomUnited StatesUpper middle incomeUruguayUzbekistanVanuatuVenezuela, RBVietnamVirgin Islands (U.S.)WorldYemen, Rep.ZambiaZimbabwe Zeitlinie:
Diese Zeitleiste vorliegt die Graphik ab 1971 J. bis 2009 J. Euro area. Die Angaben bis 1970 J. sind nicht vorhanden. Die Zahl aktueller Beobachtungen nach Daten: 39.
Die Quelle (Bezeichnung):
Kennzahlen der Weltentwicklung
Die Quelle (Einrichtung):
World Bank staff estimates from original source: European Commission, Joint Research Centre (JRC)/Netherlands Environmental Assessment Agency (PBL). Emission Database for Global Atmospheric Research (EDGAR): http://edgar.jrc.ec.europa.eu/.
Kategorien:
Energy & Mining, Environment
Es wurde aktualisiert:
23 Apr 2017 Jahr
Kennzahlen der Wertänderungen vom Jahr zum Jahr
Minimum:
5.16
1 Jan 1975 Jahr
Maximum:
10.965
1 Jan 2009 Jahr
Zum Datum der Beobachtung
Wert
Absolute Veränderung
Die Veränderung bezüglich dem vorherigen Wert
1 Jan 1971 Jahr
5.537
+5.537
0.0%
1 Jan 1972 Jahr
5.431
-0.106
-1.92%
1 Jan 1973 Jahr
5.483
+0.052
0.96%
1 Jan 1974 Jahr
5.412
-0.071
-1.29%
1 Jan 1975 Jahr
5.16
-0.252
-4.66%
1 Jan 1976 Jahr
5.253
+0.093
1.8%
1 Jan 1977 Jahr
5.45
+0.197
3.75%
1 Jan 1978 Jahr
5.485
+0.035
0.64%
1 Jan 1979 Jahr
5.639
+0.154
2.81%
1 Jan 1980 Jahr
5.692
+0.053
0.93%
1 Jan 1981 Jahr
5.977
+0.285
5.0%
1 Jan 1982 Jahr
5.955
-0.022
-0.36%
1 Jan 1983 Jahr
6.186
+0.231
3.87%
1 Jan 1984 Jahr
6.16
-0.025
-0.41%
1 Jan 1985 Jahr
6.081
-0.079
-1.28%
1 Jan 1986 Jahr
6.157
+0.076
1.24%
1 Jan 1987 Jahr
6.255
+0.098
1.59%
1 Jan 1988 Jahr
6.314
+0.059
0.95%
1 Jan 1989 Jahr
6.593
+0.279
4.41%
1 Jan 1990 Jahr
6.962
+0.369
5.6%
1 Jan 1991 Jahr
7.216
+0.254
3.64%
1 Jan 1992 Jahr
7.465
+0.25
3.46%
1 Jan 1993 Jahr
7.493
+0.027
0.37%
1 Jan 1994 Jahr
7.671
+0.178
2.38%
1 Jan 1995 Jahr
7.465
-0.206
-2.68%
1 Jan 1996 Jahr
7.685
+0.219
2.94%
1 Jan 1997 Jahr
7.614
-0.071
-0.92%
1 Jan 1998 Jahr
7.502
-0.112
-1.47%
1 Jan 1999 Jahr
8.273
+0.771
10.28%
1 Jan 2000 Jahr
8.706
+0.433
5.23%
1 Jan 2001 Jahr
9.082
+0.376
4.31%
1 Jan 2002 Jahr
9.722
+0.641
7.05%
1 Jan 2003 Jahr
9.782
+0.059
0.61%
1 Jan 2004 Jahr
10.209
+0.428
4.37%
1 Jan 2005 Jahr
10.401
+0.192
1.88%
1 Jan 2006 Jahr
10.115
-0.286
-2.75%
1 Jan 2007 Jahr
10.651
+0.535
5.29%
1 Jan 2008 Jahr
10.835
+0.185
1.74%
1 Jan 2009 Jahr
10.965
+0.129
1.19%
Bewertung der Länder gemäß mit laufender Statistik nach Jahren


Kommentare: