29
/de/
de
AIzaSyAYiBZKx7MnpbEhh9jyipgxe19OcubqV5w
April 1, 2024
30008
Euro area
EMU
false
2
1
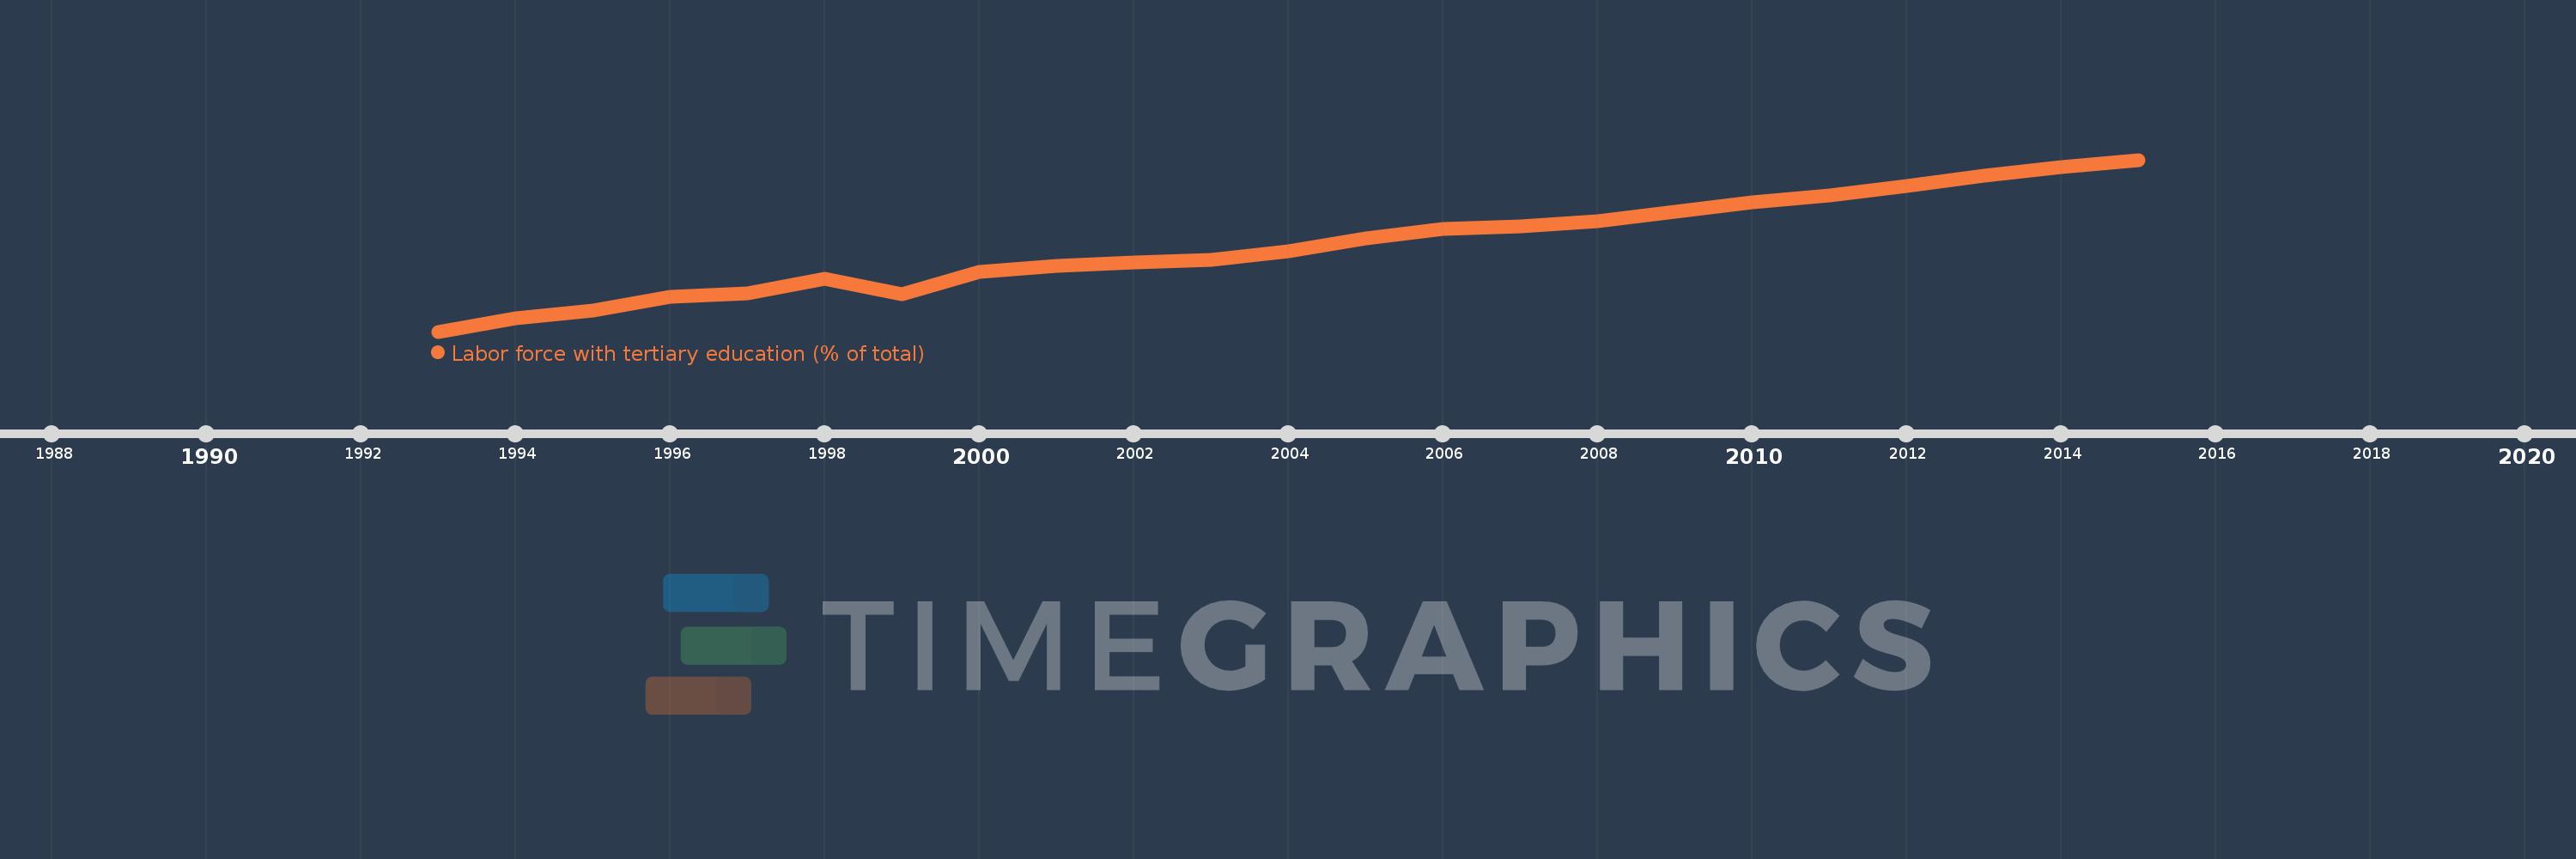
Labor force with tertiary education (% of total)
2015,2014,2013,2012,2011,2010,2009,2008,2007,2006,2005,2004,2003,2002,2001,2000,1999,1998,1997,1996,1995,1994,1993
Diese Statistik in anderen Ländern:
Zeitlinie:
Diese Zeitleiste vorliegt die Graphik ab 1993 J. bis 2015 J. Euro area. Die Angaben bis 1992 J. sind nicht vorhanden. Die Zahl aktueller Beobachtungen nach Daten: 23.
Die Quelle (Bezeichnung):
Kennzahlen der Weltentwicklung
Die Quelle (Einrichtung):
International Labour Organization, Key Indicators of the Labour Market database.
Kategorien:
Education, Social Protection & Labor
Es wurde aktualisiert:
23 Apr 2017 Jahr
Kennzahlen der Wertänderungen vom Jahr zum Jahr
Minimum:
15.996
1 Jan 1993 Jahr
Maximum:
30.56
1 Jan 2015 Jahr
Zum Datum der Beobachtung
Wert
Absolute Veränderung
Die Veränderung bezüglich dem vorherigen Wert
1 Jan 1993 Jahr
15.996
+15.996
0.0%
1 Jan 1994 Jahr
17.124
+1.129
7.06%
1 Jan 1995 Jahr
17.748
+0.623
3.64%
1 Jan 1996 Jahr
18.95
+1.202
6.77%
1 Jan 1997 Jahr
19.216
+0.267
1.41%
1 Jan 1998 Jahr
20.456
+1.24
6.45%
1 Jan 1999 Jahr
19.183
-1.273
-6.22%
1 Jan 2000 Jahr
21.035
+1.852
9.66%
1 Jan 2001 Jahr
21.578
+0.542
2.58%
1 Jan 2002 Jahr
21.83
+0.253
1.17%
1 Jan 2003 Jahr
22.045
+0.215
0.98%
1 Jan 2004 Jahr
22.818
+0.773
3.51%
1 Jan 2005 Jahr
23.895
+1.078
4.72%
1 Jan 2006 Jahr
24.685
+0.79
3.31%
1 Jan 2007 Jahr
24.884
+0.198
0.8%
1 Jan 2008 Jahr
25.379
+0.495
1.99%
1 Jan 2009 Jahr
26.15
+0.772
3.04%
1 Jan 2010 Jahr
26.983
+0.832
3.18%
1 Jan 2011 Jahr
27.537
+0.554
2.05%
1 Jan 2012 Jahr
28.365
+0.828
3.01%
1 Jan 2013 Jahr
29.192
+0.827
2.92%
1 Jan 2014 Jahr
29.956
+0.765
2.62%
1 Jan 2015 Jahr
30.56
+0.604
2.02%
Bewertung der Länder gemäß mit laufender Statistik nach Jahren


Kommentare: