29
/de/
de
AIzaSyAYiBZKx7MnpbEhh9jyipgxe19OcubqV5w
April 1, 2024
29960
Euro area
EMU
false
2
1
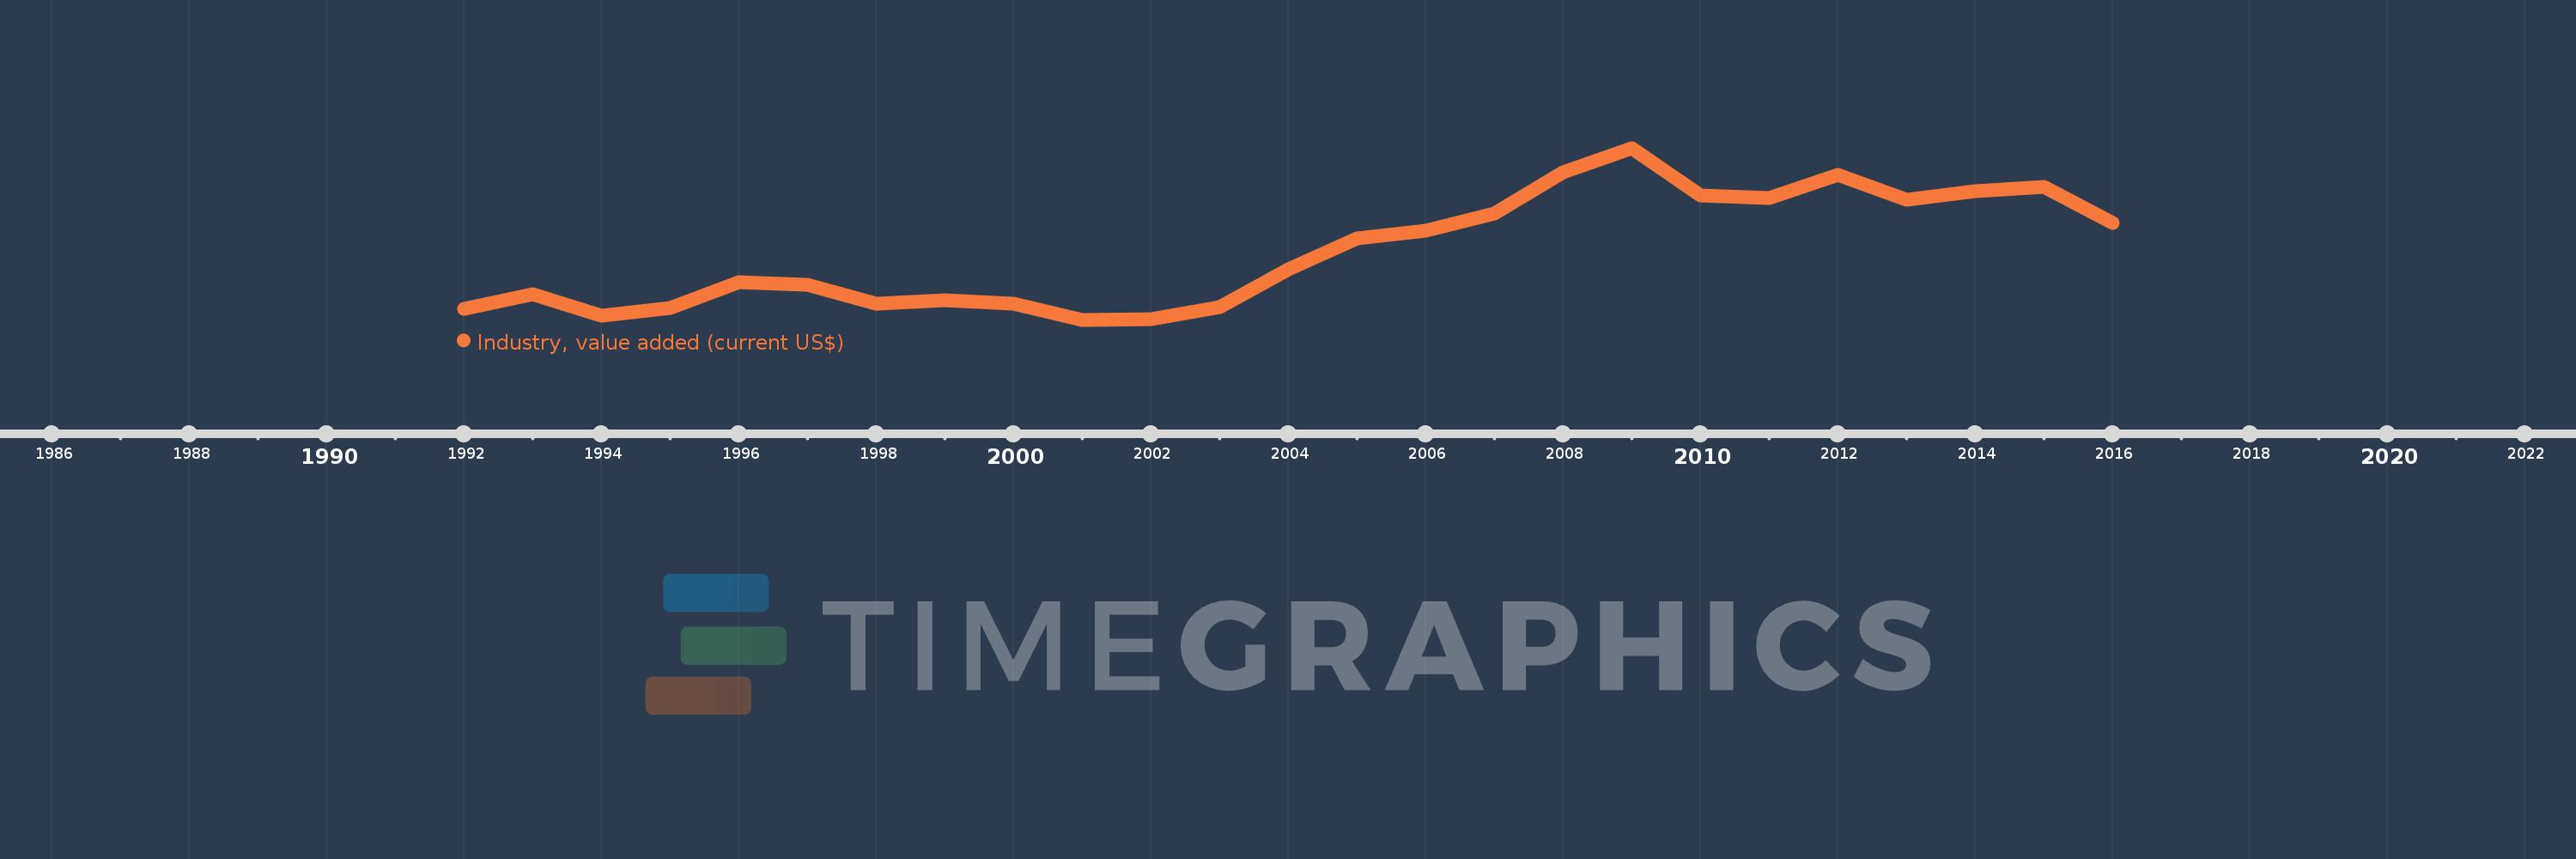
Industry, value added (current US$)
2016,2015,2014,2013,2012,2011,2010,2009,2008,2007,2006,2005,2004,2003,2002,2001,2000,1999,1998,1997,1996,1995,1994,1993,1992
Diese Statistik in anderen Ländern:
AfghanistanAlbaniaAlgeriaAndorraAngolaAntigua and BarbudaArab WorldArgentinaArmeniaArubaAustraliaAustriaAzerbaijanBahamas, TheBahrainBangladeshBarbadosBelarusBelgiumBelizeBeninBermudaBhutanBoliviaBosnia and HerzegovinaBotswanaBrazilBrunei DarussalamBulgariaBurkina FasoBurundiCabo VerdeCambodiaCameroonCanadaCaribbean small statesCayman IslandsCentral African RepublicCentral Europe and the BalticsChadChileChinaColombiaComorosCongo, Dem. Rep.Congo, Rep.Costa RicaCote d'IvoireCroatiaCubaCyprusCzech RepublicDenmarkDjiboutiDominicaDominican RepublicEarly-demographic dividendEast Asia & PacificEast Asia & Pacific (excluding high income)East Asia & Pacific (IDA & IBRD countries)EcuadorEgypt, Arab Rep.El SalvadorEquatorial GuineaEritreaEstoniaEthiopiaEuro areaEurope & Central AsiaEurope & Central Asia (excluding high income)Europe & Central Asia (IDA & IBRD countries)European UnionFijiFinlandFragile and conflict affected situationsFranceGabonGambia, TheGeorgiaGermanyGhanaGreeceGrenadaGuatemalaGuineaGuinea-BissauGuyanaHeavily indebted poor countries (HIPC)High incomeHondurasHong Kong SAR, ChinaHungaryIBRD onlyIcelandIDA & IBRD totalIDA blendIDA onlyIDA totalIndiaIndonesiaIran, Islamic Rep.IraqIrelandItalyJamaicaJapanJordanKazakhstanKenyaKiribatiKorea, Rep.KosovoKuwaitKyrgyz RepublicLao PDRLate-demographic dividendLatin America & Caribbean Latin America & Caribbean (excluding high income)Latin America & the Caribbean (IDA & IBRD countries)LatviaLeast developed countries: UN classificationLebanonLesothoLiberiaLibyaLiechtensteinLithuaniaLow & middle incomeLow incomeLower middle incomeLuxembourgMacao SAR, ChinaMacedonia, FYRMadagascarMalawiMalaysiaMaldivesMaliMaltaMarshall IslandsMauritaniaMauritiusMexicoMicronesia, Fed. Sts.Middle East & North AfricaMiddle East & North Africa (excluding high income)Middle East & North Africa (IDA & IBRD countries)Middle incomeMoldovaMongoliaMontenegroMoroccoMozambiqueMyanmarNamibiaNepalNetherlandsNew CaledoniaNew ZealandNicaraguaNigerNigeriaNorth AmericaNorwayOECD membersOmanOther small statesPacific island small statesPakistanPalauPanamaPapua New GuineaParaguayPeruPhilippinesPolandPortugalPost-demographic dividendPre-demographic dividendPuerto RicoQatarRomaniaRussian FederationRwandaSamoaSao Tome and PrincipeSaudi ArabiaSenegalSerbiaSeychellesSierra LeoneSingaporeSlovak RepublicSloveniaSmall statesSolomon IslandsSouth AfricaSouth AsiaSouth Asia (IDA & IBRD)SpainSri LankaSt. Kitts and NevisSt. LuciaSt. Vincent and the GrenadinesSub-Saharan Africa Sub-Saharan Africa (excluding high income)Sub-Saharan Africa (IDA & IBRD countries)SudanSurinameSwazilandSwedenSwitzerlandSyrian Arab RepublicTajikistanTanzaniaThailandTimor-LesteTogoTongaTrinidad and TobagoTunisiaTurkeyTurkmenistanTuvaluUgandaUkraineUnited Arab EmiratesUnited KingdomUnited StatesUpper middle incomeUruguayUzbekistanVanuatuVenezuela, RBVietnamWest Bank and GazaWorldYemen, Rep.ZambiaZimbabwe Zeitlinie:
Diese Zeitleiste vorliegt die Graphik ab 1992 J. bis 2016 J. Euro area. Die Angaben bis 1991 J. sind nicht vorhanden. Die Zahl aktueller Beobachtungen nach Daten: 25.
Die Quelle (Bezeichnung):
Kennzahlen der Weltentwicklung
Die Quelle (Einrichtung):
World Bank national accounts data, and OECD National Accounts data files.
Kategorien:
Economy & Growth
Es wurde aktualisiert:
23 Apr 2017 Jahr
Kennzahlen der Wertänderungen vom Jahr zum Jahr
im Durchschnitt:
2.313 Trln
Minimum:
1.633 Trln
1 Jan 2001 Jahr
Maximum:
3.346 Trln
1 Jan 2009 Jahr
Zum Datum der Beobachtung
Wert
Absolute Veränderung
Die Veränderung bezüglich dem vorherigen Wert
1 Jan 1992 Jahr
1.744 Trln
+1.744 Trln
0.0%
1 Jan 1993 Jahr
1.886 Trln
+141.227 Mlrd.
8.1%
1 Jan 1994 Jahr
1.676 Trln
-209.401 Mlrd.
-11.11%
1 Jan 1995 Jahr
1.75 Trln
+74.039 Mlrd.
4.42%
1 Jan 1996 Jahr
2.005 Trln
+254.829 Mlrd.
14.56%
1 Jan 1997 Jahr
1.981 Trln
-24.513 Mlrd.
-1.22%
1 Jan 1998 Jahr
1.792 Trln
-188.599 Mlrd.
-9.52%
1 Jan 1999 Jahr
1.831 Trln
+39.317 Mlrd.
2.19%
1 Jan 2000 Jahr
1.792 Trln
-39.169 Mlrd.
-2.14%
1 Jan 2001 Jahr
1.633 Trln
-159.193 Mlrd.
-8.88%
1 Jan 2002 Jahr
1.641 Trln
+8.338 Mlrd.
0.51%
1 Jan 2003 Jahr
1.758 Trln
+116.35 Mlrd.
7.09%
1 Jan 2004 Jahr
2.138 Trln
+380.329 Mlrd.
21.64%
1 Jan 2005 Jahr
2.444 Trln
+306.45 Mlrd.
14.33%
1 Jan 2006 Jahr
2.517 Trln
+72.539 Mlrd.
2.97%
1 Jan 2007 Jahr
2.696 Trln
+178.869 Mlrd.
7.11%
1 Jan 2008 Jahr
3.102 Trln
+405.882 Mlrd.
15.06%
1 Jan 2009 Jahr
3.346 Trln
+244.166 Mlrd.
7.87%
1 Jan 2010 Jahr
2.874 Trln
-471.937 Mlrd.
-14.11%
1 Jan 2011 Jahr
2.847 Trln
-26.786 Mlrd.
-0.93%
1 Jan 2012 Jahr
3.075 Trln
+227.857 Mlrd.
8.0%
1 Jan 2013 Jahr
2.827 Trln
-248.096 Mlrd.
-8.07%
1 Jan 2014 Jahr
2.916 Trln
+89.501 Mlrd.
3.17%
1 Jan 2015 Jahr
2.96 Trln
+43.351 Mlrd.
1.49%
1 Jan 2016 Jahr
2.594 Trln
-365.407 Mlrd.
-12.35%
Bewertung der Länder gemäß mit laufender Statistik nach Jahren


Kommentare: