29
/de/
de
AIzaSyAYiBZKx7MnpbEhh9jyipgxe19OcubqV5w
April 1, 2024
29949
Euro area
EMU
false
2
1
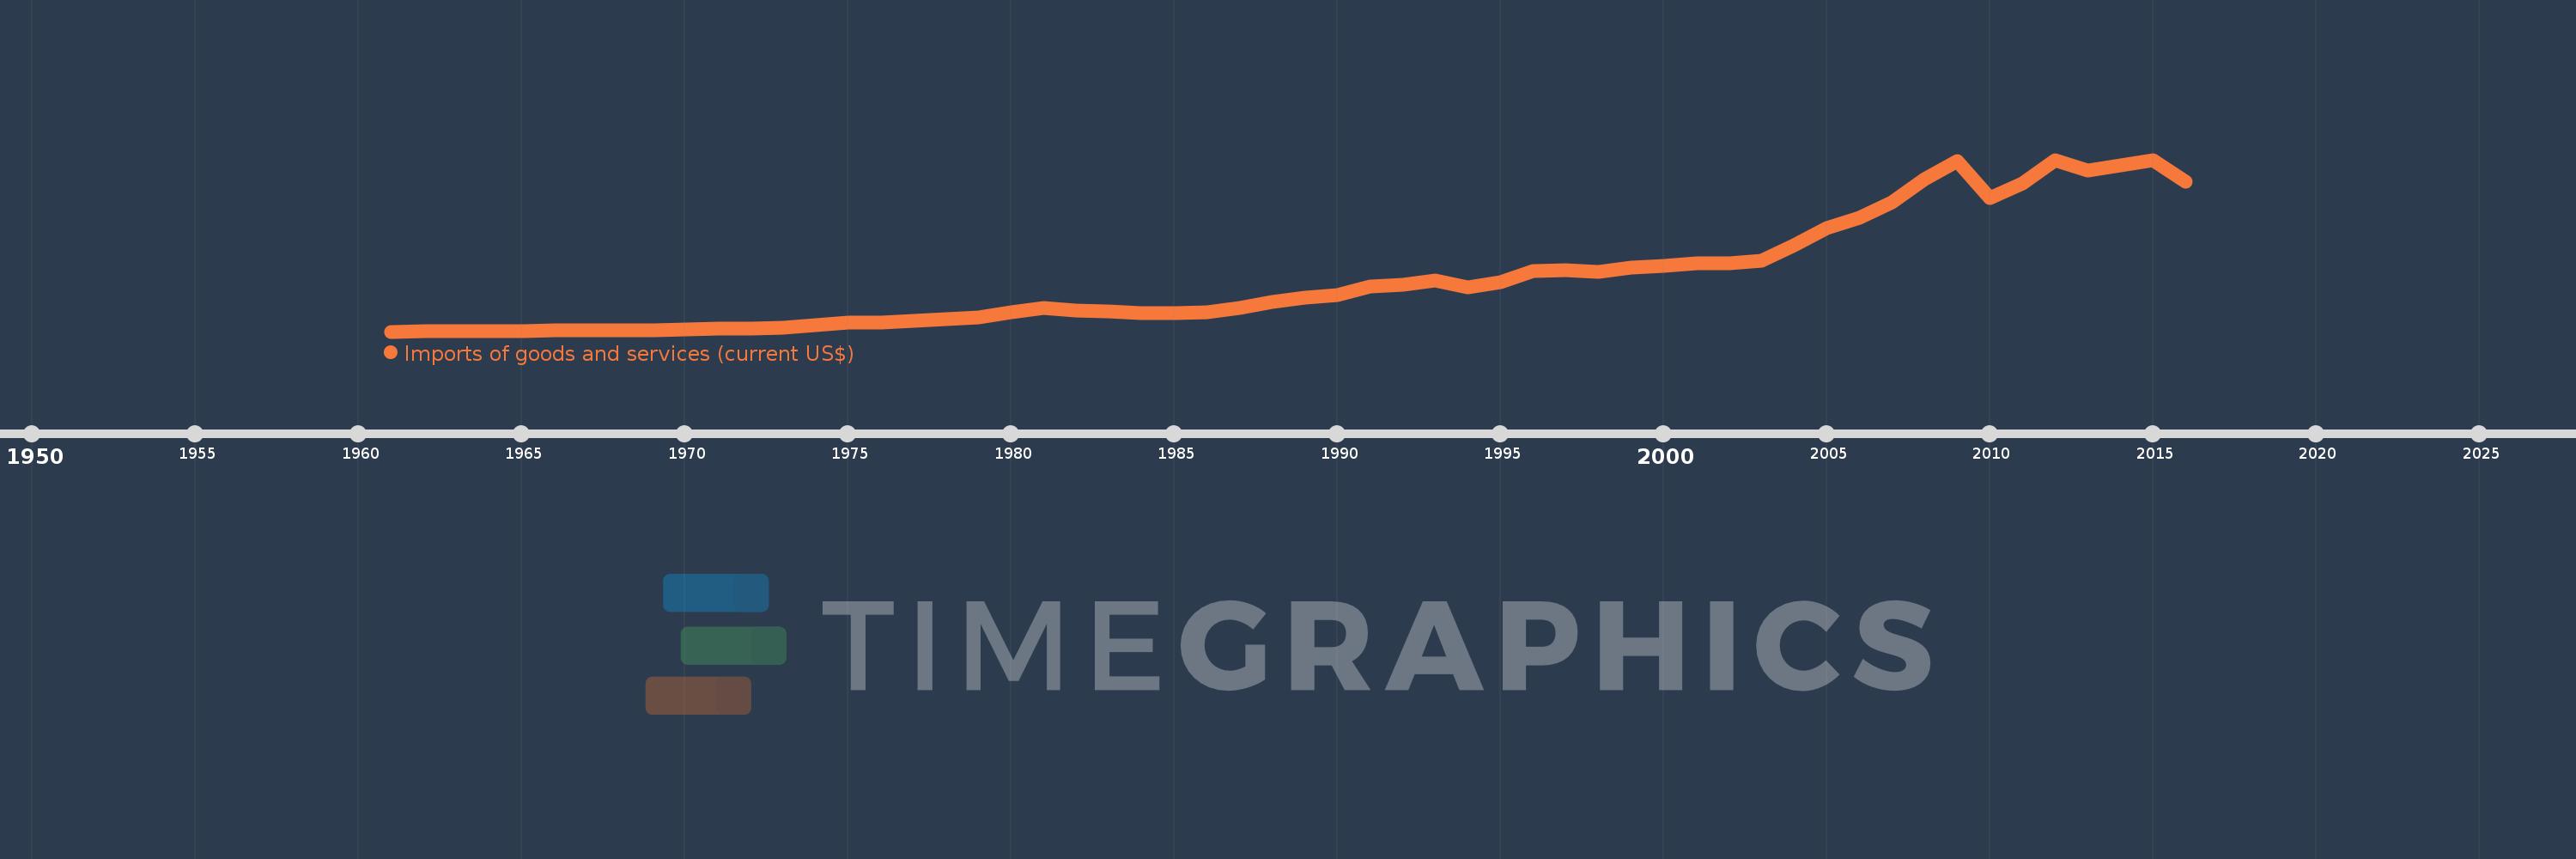
Imports of goods and services (current US$)
2016,2015,2014,2013,2012,2011,2010,2009,2008,2007,2006,2005,2004,2003,2002,2001,2000,1999,1998,1997,1996,1995,1994,1993,1992,1991,1990,1989,1988,1987,1986,1985,1984,1983,1982,1981,1980,1979,1978,1977,1976,1975,1974,1973,1972,1971,1970,1969,1968,1967,1966,1965,1964,1963,1962,1961
Diese Statistik in anderen Ländern:
AfghanistanAlbaniaAlgeriaAngolaAntigua and BarbudaArab WorldArgentinaArmeniaArubaAustraliaAustriaAzerbaijanBahamas, TheBahrainBangladeshBarbadosBelarusBelgiumBelizeBeninBermudaBhutanBoliviaBosnia and HerzegovinaBotswanaBrazilBrunei DarussalamBulgariaBurkina FasoBurundiCabo VerdeCambodiaCameroonCanadaCaribbean small statesCentral African RepublicCentral Europe and the BalticsChadChileChinaColombiaComorosCongo, Dem. Rep.Congo, Rep.Costa RicaCote d'IvoireCroatiaCubaCyprusCzech RepublicDenmarkDjiboutiDominicaDominican RepublicEarly-demographic dividendEast Asia & PacificEast Asia & Pacific (excluding high income)East Asia & Pacific (IDA & IBRD countries)EcuadorEgypt, Arab Rep.El SalvadorEquatorial GuineaEritreaEstoniaEthiopiaEuro areaEurope & Central AsiaEurope & Central Asia (excluding high income)Europe & Central Asia (IDA & IBRD countries)European UnionFaroe IslandsFijiFinlandFragile and conflict affected situationsFranceFrench PolynesiaGabonGambia, TheGeorgiaGermanyGhanaGreeceGrenadaGuatemalaGuineaGuinea-BissauGuyanaHaitiHeavily indebted poor countries (HIPC)High incomeHondurasHong Kong SAR, ChinaHungaryIBRD onlyIcelandIDA & IBRD totalIDA blendIDA onlyIDA totalIndiaIndonesiaIran, Islamic Rep.IraqIrelandIsraelItalyJamaicaJapanJordanKazakhstanKenyaKiribatiKorea, Rep.KosovoKuwaitKyrgyz RepublicLao PDRLate-demographic dividendLatin America & Caribbean Latin America & Caribbean (excluding high income)Latin America & the Caribbean (IDA & IBRD countries)LatviaLeast developed countries: UN classificationLebanonLesothoLiberiaLibyaLithuaniaLow & middle incomeLow incomeLower middle incomeLuxembourgMacao SAR, ChinaMacedonia, FYRMadagascarMalawiMalaysiaMaldivesMaliMaltaMauritaniaMauritiusMexicoMicronesia, Fed. Sts.Middle East & North AfricaMiddle East & North Africa (excluding high income)Middle East & North Africa (IDA & IBRD countries)Middle incomeMoldovaMongoliaMontenegroMoroccoMozambiqueMyanmarNamibiaNepalNetherlandsNew CaledoniaNew ZealandNicaraguaNigerNigeriaNorth AmericaNorwayOECD membersOmanOther small statesPacific island small statesPakistanPalauPanamaPapua New GuineaParaguayPeruPhilippinesPolandPortugalPost-demographic dividendPre-demographic dividendPuerto RicoQatarRomaniaRussian FederationRwandaSamoaSaudi ArabiaSenegalSerbiaSeychellesSierra LeoneSingaporeSlovak RepublicSloveniaSmall statesSolomon IslandsSomaliaSouth AfricaSouth AsiaSouth Asia (IDA & IBRD)South SudanSpainSri LankaSt. Kitts and NevisSt. LuciaSt. Vincent and the GrenadinesSub-Saharan Africa Sub-Saharan Africa (excluding high income)Sub-Saharan Africa (IDA & IBRD countries)SudanSurinameSwazilandSwedenSwitzerlandSyrian Arab RepublicTajikistanTanzaniaThailandTimor-LesteTogoTongaTrinidad and TobagoTunisiaTurkeyTurkmenistanUgandaUkraineUnited Arab EmiratesUnited KingdomUnited StatesUpper middle incomeUruguayUzbekistanVanuatuVenezuela, RBVietnamWest Bank and GazaWorldYemen, Rep.ZambiaZimbabwe Zeitlinie:
Diese Zeitleiste vorliegt die Graphik ab 1961 J. bis 2016 J. Euro area. Die Angaben bis 1960 J. sind nicht vorhanden. Die Zahl aktueller Beobachtungen nach Daten: 56.
Die Quelle (Bezeichnung):
Kennzahlen der Weltentwicklung
Die Quelle (Einrichtung):
World Bank national accounts data, and OECD National Accounts data files.
Kategorien:
Economy & Growth, Trade
Es wurde aktualisiert:
23 Apr 2017 Jahr
Kennzahlen der Wertänderungen vom Jahr zum Jahr
im Durchschnitt:
1.729 Trln
Minimum:
42.193 Mlrd.
1 Jan 1961 Jahr
Maximum:
5.533 Trln
1 Jan 2015 Jahr
Zum Datum der Beobachtung
Wert
Absolute Veränderung
Die Veränderung bezüglich dem vorherigen Wert
1 Jan 1961 Jahr
42.193 Mlrd.
+42.193 Mlrd.
0.0%
1 Jan 1962 Jahr
46.49 Mlrd.
+4.296 Mlrd.
10.18%
1 Jan 1963 Jahr
51.188 Mlrd.
+4.698 Mlrd.
10.11%
1 Jan 1964 Jahr
59.048 Mlrd.
+7.861 Mlrd.
15.36%
1 Jan 1965 Jahr
66.447 Mlrd.
+7.399 Mlrd.
12.53%
1 Jan 1966 Jahr
71.206 Mlrd.
+4.759 Mlrd.
7.16%
1 Jan 1967 Jahr
79.882 Mlrd.
+8.676 Mlrd.
12.18%
1 Jan 1968 Jahr
84.382 Mlrd.
+4.501 Mlrd.
5.63%
1 Jan 1969 Jahr
92.223 Mlrd.
+7.84 Mlrd.
9.29%
1 Jan 1970 Jahr
109.497 Mlrd.
+17.275 Mlrd.
18.73%
1 Jan 1971 Jahr
125.342 Mlrd.
+15.844 Mlrd.
14.47%
1 Jan 1972 Jahr
140.331 Mlrd.
+14.989 Mlrd.
11.96%
1 Jan 1973 Jahr
170.027 Mlrd.
+29.696 Mlrd.
21.16%
1 Jan 1974 Jahr
234.653 Mlrd.
+64.626 Mlrd.
38.01%
1 Jan 1975 Jahr
318.349 Mlrd.
+83.696 Mlrd.
35.67%
1 Jan 1976 Jahr
334.711 Mlrd.
+16.362 Mlrd.
5.14%
1 Jan 1977 Jahr
378.729 Mlrd.
+44.017 Mlrd.
13.15%
1 Jan 1978 Jahr
428.577 Mlrd.
+49.848 Mlrd.
13.16%
1 Jan 1979 Jahr
502.557 Mlrd.
+73.98 Mlrd.
17.26%
1 Jan 1980 Jahr
654.523 Mlrd.
+151.966 Mlrd.
30.24%
1 Jan 1981 Jahr
794.648 Mlrd.
+140.125 Mlrd.
21.41%
1 Jan 1982 Jahr
713.205 Mlrd.
-81.443 Mlrd.
-10.25%
1 Jan 1983 Jahr
679.739 Mlrd.
-33.466 Mlrd.
-4.69%
1 Jan 1984 Jahr
644.956 Mlrd.
-34.783 Mlrd.
-5.12%
1 Jan 1985 Jahr
645.706 Mlrd.
+749.51 Mln.
0.12%
1 Jan 1986 Jahr
667.386 Mlrd.
+21.68 Mlrd.
3.36%
1 Jan 1987 Jahr
807.995 Mlrd.
+140.609 Mlrd.
21.07%
1 Jan 1988 Jahr
996.248 Mlrd.
+188.253 Mlrd.
23.3%
1 Jan 1989 Jahr
1.12 Trln
+123.938 Mlrd.
12.44%
1 Jan 1990 Jahr
1.212 Trln
+91.593 Mlrd.
8.18%
1 Jan 1991 Jahr
1.496 Trln
+284.28 Mlrd.
23.46%
1 Jan 1992 Jahr
1.548 Trln
+51.532 Mlrd.
3.44%
1 Jan 1993 Jahr
1.667 Trln
+119.228 Mlrd.
7.7%
1 Jan 1994 Jahr
1.449 Trln
-217.677 Mlrd.
-13.06%
1 Jan 1995 Jahr
1.613 Trln
+163.999 Mlrd.
11.32%
1 Jan 1996 Jahr
1.97 Trln
+356.571 Mlrd.
22.1%
1 Jan 1997 Jahr
2.003 Trln
+32.936 Mlrd.
1.67%
1 Jan 1998 Jahr
1.964 Trln
-38.985 Mlrd.
-1.95%
1 Jan 1999 Jahr
2.082 Trln
+118.829 Mlrd.
6.05%
1 Jan 2000 Jahr
2.136 Trln
+53.697 Mlrd.
2.58%
1 Jan 2001 Jahr
2.225 Trln
+88.376 Mlrd.
4.14%
1 Jan 2002 Jahr
2.218 Trln
-6.636 Mlrd.
-0.3%
1 Jan 2003 Jahr
2.297 Trln
+79.082 Mlrd.
3.57%
1 Jan 2004 Jahr
2.794 Trln
+497.019 Mlrd.
21.64%
1 Jan 2005 Jahr
3.343 Trln
+549.339 Mlrd.
19.66%
1 Jan 2006 Jahr
3.672 Trln
+328.229 Mlrd.
9.82%
1 Jan 2007 Jahr
4.165 Trln
+493.132 Mlrd.
13.43%
1 Jan 2008 Jahr
4.905 Trln
+739.929 Mlrd.
17.77%
1 Jan 2009 Jahr
5.498 Trln
+593.26 Mlrd.
12.1%
1 Jan 2010 Jahr
4.323 Trln
-1.175 Trln
-21.37%
1 Jan 2011 Jahr
4.768 Trln
+444.814 Mlrd.
10.29%
1 Jan 2012 Jahr
5.526 Trln
+757.866 Mlrd.
15.9%
1 Jan 2013 Jahr
5.189 Trln
-336.225 Mlrd.
-6.08%
1 Jan 2014 Jahr
5.365 Trln
+175.132 Mlrd.
3.37%
1 Jan 2015 Jahr
5.533 Trln
+168.275 Mlrd.
3.14%
1 Jan 2016 Jahr
4.82 Trln
-712.834 Mlrd.
-12.88%
Bewertung der Länder gemäß mit laufender Statistik nach Jahren


Kommentare: