29
/de/
de
AIzaSyAYiBZKx7MnpbEhh9jyipgxe19OcubqV5w
April 1, 2024
28124
East Asia & Pacific (excluding high income)
EAP
false
2
1
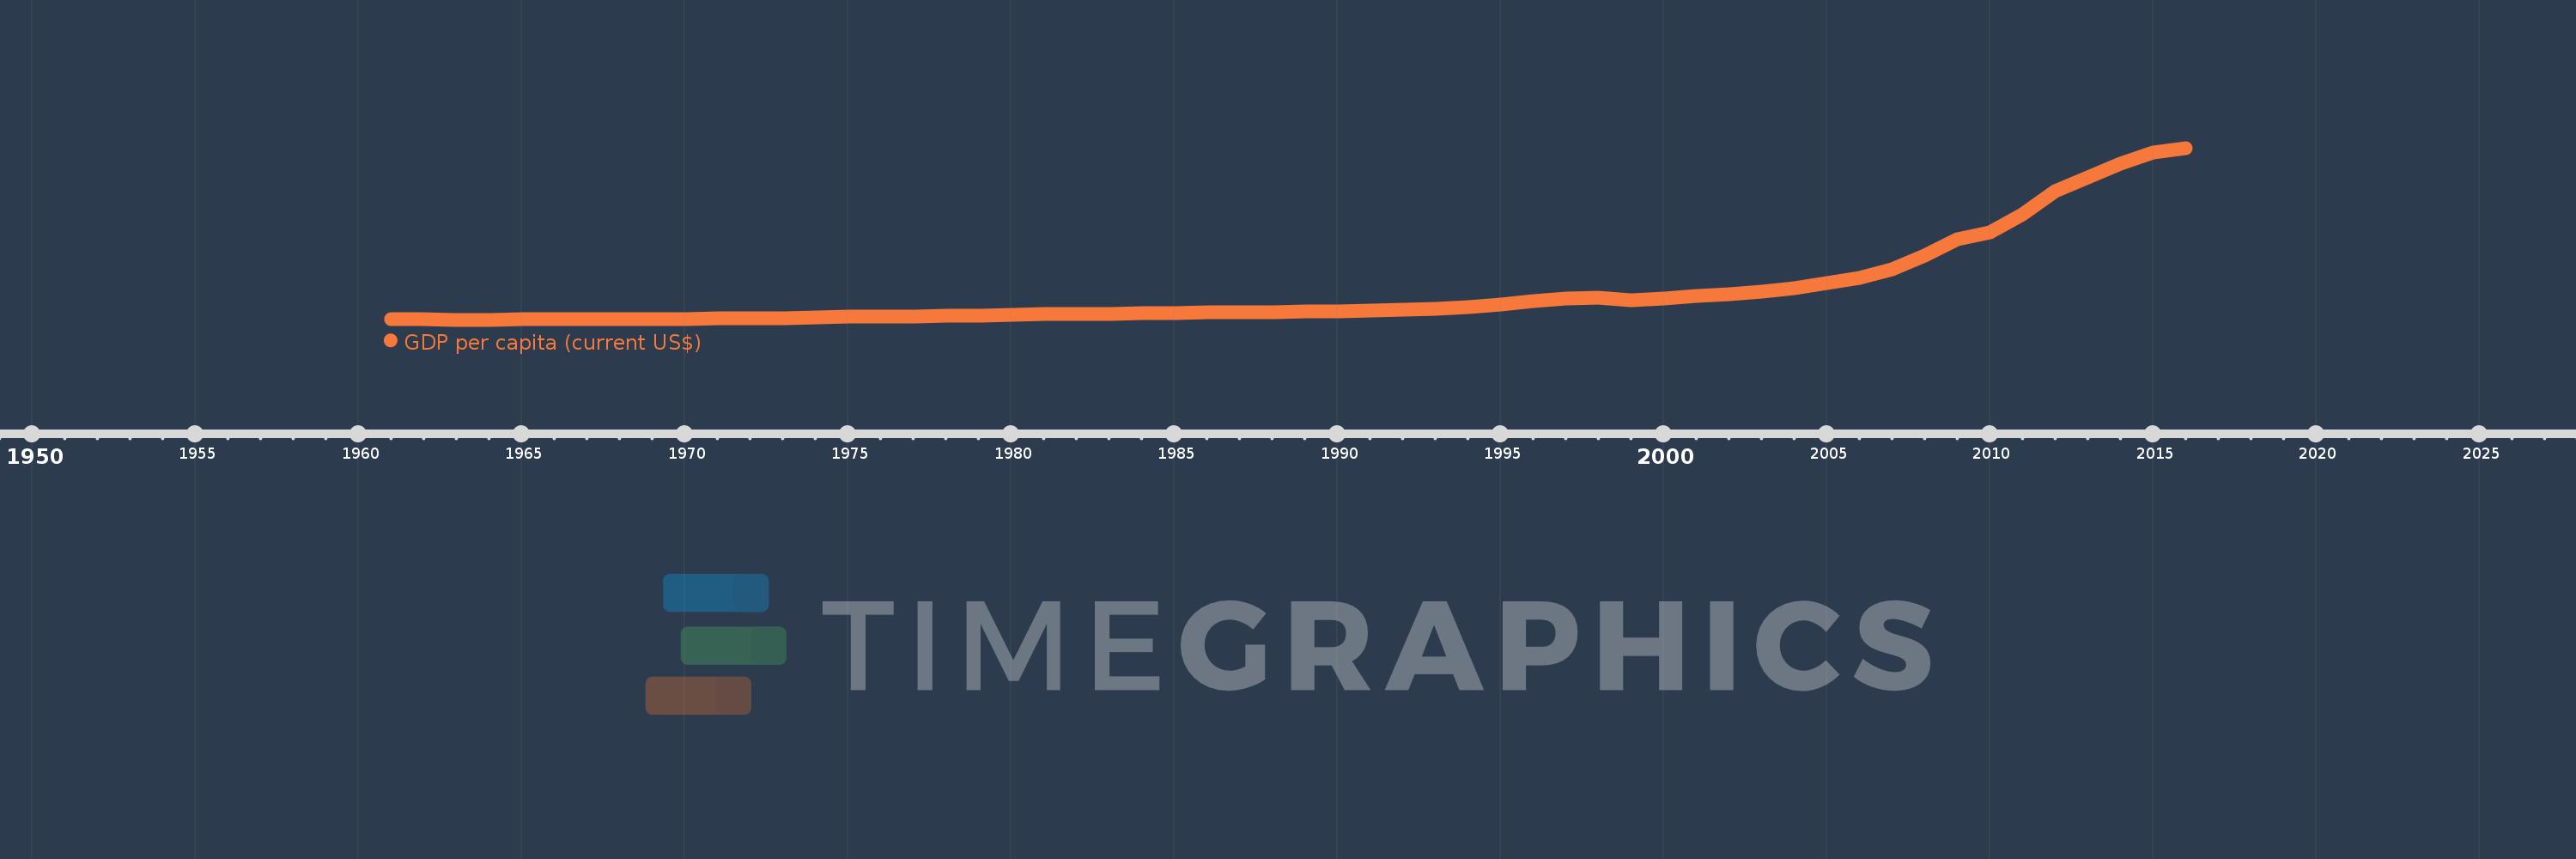
GDP per capita (current US$)
2016,2015,2014,2013,2012,2011,2010,2009,2008,2007,2006,2005,2004,2003,2002,2001,2000,1999,1998,1997,1996,1995,1994,1993,1992,1991,1990,1989,1988,1987,1986,1985,1984,1983,1982,1981,1980,1979,1978,1977,1976,1975,1974,1973,1972,1971,1970,1969,1968,1967,1966,1965,1964,1963,1962,1961
Diese Statistik in anderen Ländern:
AfghanistanAlbaniaAlgeriaAndorraAngolaAntigua and BarbudaArab WorldArgentinaArmeniaArubaAustraliaAustriaAzerbaijanBahamas, TheBahrainBangladeshBarbadosBelarusBelgiumBelizeBeninBermudaBhutanBoliviaBosnia and HerzegovinaBotswanaBrazilBrunei DarussalamBulgariaBurkina FasoBurundiCabo VerdeCambodiaCameroonCanadaCaribbean small statesCayman IslandsCentral African RepublicCentral Europe and the BalticsChadChannel IslandsChileChinaColombiaComorosCongo, Dem. Rep.Congo, Rep.Costa RicaCote d'IvoireCroatiaCubaCyprusCzech RepublicDenmarkDjiboutiDominicaDominican RepublicEarly-demographic dividendEast Asia & PacificEast Asia & Pacific (excluding high income)East Asia & Pacific (IDA & IBRD countries)EcuadorEgypt, Arab Rep.El SalvadorEquatorial GuineaEritreaEstoniaEthiopiaEuro areaEurope & Central AsiaEurope & Central Asia (excluding high income)Europe & Central Asia (IDA & IBRD countries)European UnionFaroe IslandsFijiFinlandFragile and conflict affected situationsFranceFrench PolynesiaGabonGambia, TheGeorgiaGermanyGhanaGreeceGreenlandGrenadaGuatemalaGuineaGuinea-BissauGuyanaHaitiHeavily indebted poor countries (HIPC)High incomeHondurasHong Kong SAR, ChinaHungaryIBRD onlyIcelandIDA & IBRD totalIDA blendIDA onlyIDA totalIndiaIndonesiaIran, Islamic Rep.IraqIrelandIsle of ManIsraelItalyJamaicaJapanJordanKazakhstanKenyaKiribatiKorea, Rep.KosovoKuwaitKyrgyz RepublicLao PDRLate-demographic dividendLatin America & Caribbean Latin America & Caribbean (excluding high income)Latin America & the Caribbean (IDA & IBRD countries)LatviaLeast developed countries: UN classificationLebanonLesothoLiberiaLibyaLiechtensteinLithuaniaLow & middle incomeLow incomeLower middle incomeLuxembourgMacao SAR, ChinaMacedonia, FYRMadagascarMalawiMalaysiaMaldivesMaliMaltaMarshall IslandsMauritaniaMauritiusMexicoMicronesia, Fed. Sts.Middle East & North AfricaMiddle East & North Africa (excluding high income)Middle East & North Africa (IDA & IBRD countries)Middle incomeMoldovaMonacoMongoliaMontenegroMoroccoMozambiqueMyanmarNamibiaNauruNepalNetherlandsNew CaledoniaNew ZealandNicaraguaNigerNigeriaNorth AmericaNorwayOECD membersOmanOther small statesPacific island small statesPakistanPalauPanamaPapua New GuineaParaguayPeruPhilippinesPolandPortugalPost-demographic dividendPre-demographic dividendPuerto RicoQatarRomaniaRussian FederationRwandaSamoaSan MarinoSao Tome and PrincipeSaudi ArabiaSenegalSerbiaSeychellesSierra LeoneSingaporeSlovak RepublicSloveniaSmall statesSolomon IslandsSomaliaSouth AfricaSouth AsiaSouth Asia (IDA & IBRD)South SudanSpainSri LankaSt. Kitts and NevisSt. LuciaSt. Vincent and the GrenadinesSub-Saharan Africa Sub-Saharan Africa (excluding high income)Sub-Saharan Africa (IDA & IBRD countries)SudanSurinameSwazilandSwedenSwitzerlandSyrian Arab RepublicTajikistanTanzaniaThailandTimor-LesteTogoTongaTrinidad and TobagoTunisiaTurkeyTurkmenistanTuvaluUgandaUkraineUnited Arab EmiratesUnited KingdomUnited StatesUpper middle incomeUruguayUzbekistanVanuatuVenezuela, RBVietnamVirgin Islands (U.S.)West Bank and GazaWorldYemen, Rep.ZambiaZimbabwe Zeitlinie:
Diese Zeitleiste vorliegt die Graphik ab 1961 J. bis 2016 J. East Asia & Pacific (excluding high income). Die Angaben bis 1960 J. sind nicht vorhanden. Die Zahl aktueller Beobachtungen nach Daten: 56.
Die Quelle (Bezeichnung):
Kennzahlen der Weltentwicklung
Die Quelle (Einrichtung):
World Bank national accounts data, and OECD National Accounts data files.
Kategorien:
Economy & Growth
Es wurde aktualisiert:
23 Apr 2017 Jahr
Kennzahlen der Wertänderungen vom Jahr zum Jahr
im Durchschnitt:
1.141 Tsnd.
Minimum:
71.134
1 Jan 1963 Jahr
Maximum:
6.488 Tsnd.
1 Jan 2016 Jahr
Zum Datum der Beobachtung
Wert
Absolute Veränderung
Die Veränderung bezüglich dem vorherigen Wert
1 Jan 1961 Jahr
89.506
+89.506
0.0%
1 Jan 1962 Jahr
78.633
-10.873
-12.15%
1 Jan 1963 Jahr
71.134
-7.499
-9.54%
1 Jan 1964 Jahr
75.132
+3.998
5.62%
1 Jan 1965 Jahr
85.047
+9.915
13.2%
1 Jan 1966 Jahr
96.855
+11.808
13.88%
1 Jan 1967 Jahr
103.16
+6.304
6.51%
1 Jan 1968 Jahr
97.406
-5.754
-5.58%
1 Jan 1969 Jahr
95.775
-1.63
-1.67%
1 Jan 1970 Jahr
104.669
+8.894
9.29%
1 Jan 1971 Jahr
113.541
+8.872
8.48%
1 Jan 1972 Jahr
118.833
+5.292
4.66%
1 Jan 1973 Jahr
131.483
+12.651
10.65%
1 Jan 1974 Jahr
161.68
+30.196
22.97%
1 Jan 1975 Jahr
178.462
+16.783
10.38%
1 Jan 1976 Jahr
196.767
+18.305
10.26%
1 Jan 1977 Jahr
196.237
-0.531
-0.27%
1 Jan 1978 Jahr
223.158
+26.921
13.72%
1 Jan 1979 Jahr
212.665
-10.493
-4.7%
1 Jan 1980 Jahr
242.496
+29.83
14.03%
1 Jan 1981 Jahr
275.58
+33.084
13.64%
1 Jan 1982 Jahr
289.571
+13.991
5.08%
1 Jan 1983 Jahr
298.841
+9.27
3.2%
1 Jan 1984 Jahr
308.415
+9.574
3.2%
1 Jan 1985 Jahr
329.613
+21.198
6.87%
1 Jan 1986 Jahr
355.511
+25.898
7.86%
1 Jan 1987 Jahr
348.592
-6.919
-1.95%
1 Jan 1988 Jahr
338.289
-10.303
-2.96%
1 Jan 1989 Jahr
368.707
+30.418
8.99%
1 Jan 1990 Jahr
391.873
+23.166
6.28%
1 Jan 1991 Jahr
413.364
+21.491
5.48%
1 Jan 1992 Jahr
441.935
+28.571
6.91%
1 Jan 1993 Jahr
488.428
+46.493
10.52%
1 Jan 1994 Jahr
529.207
+40.78
8.35%
1 Jan 1995 Jahr
628.436
+99.228
18.75%
1 Jan 1996 Jahr
765.996
+137.56
21.89%
1 Jan 1997 Jahr
869.177
+103.181
13.47%
1 Jan 1998 Jahr
889.616
+20.439
2.35%
1 Jan 1999 Jahr
806.122
-83.494
-9.39%
1 Jan 2000 Jahr
877.318
+71.196
8.83%
1 Jan 2001 Jahr
957.432
+80.114
9.13%
1 Jan 2002 Jahr
1.009 Tsnd.
+51.635
5.39%
1 Jan 2003 Jahr
1.107 Tsnd.
+97.772
9.69%
1 Jan 2004 Jahr
1.242 Tsnd.
+135.252
12.22%
1 Jan 2005 Jahr
1.429 Tsnd.
+186.519
15.02%
1 Jan 2006 Jahr
1.639 Tsnd.
+210.399
14.73%
1 Jan 2007 Jahr
1.957 Tsnd.
+318.334
19.42%
1 Jan 2008 Jahr
2.458 Tsnd.
+500.669
25.58%
1 Jan 2009 Jahr
3.09 Tsnd.
+631.671
25.7%
1 Jan 2010 Jahr
3.329 Tsnd.
+239.367
7.75%
1 Jan 2011 Jahr
4.01 Tsnd.
+680.645
20.45%
1 Jan 2012 Jahr
4.867 Tsnd.
+857.307
21.38%
1 Jan 2013 Jahr
5.391 Tsnd.
+523.529
10.76%
1 Jan 2014 Jahr
5.908 Tsnd.
+517.902
9.61%
1 Jan 2015 Jahr
6.307 Tsnd.
+398.449
6.74%
1 Jan 2016 Jahr
6.488 Tsnd.
+181.5
2.88%
Bewertung der Länder gemäß mit laufender Statistik nach Jahren


Kommentare: