29
/de/
de
AIzaSyAYiBZKx7MnpbEhh9jyipgxe19OcubqV5w
April 1, 2024
27852
East Asia & Pacific (excluding high income)
EAP
false
2
1
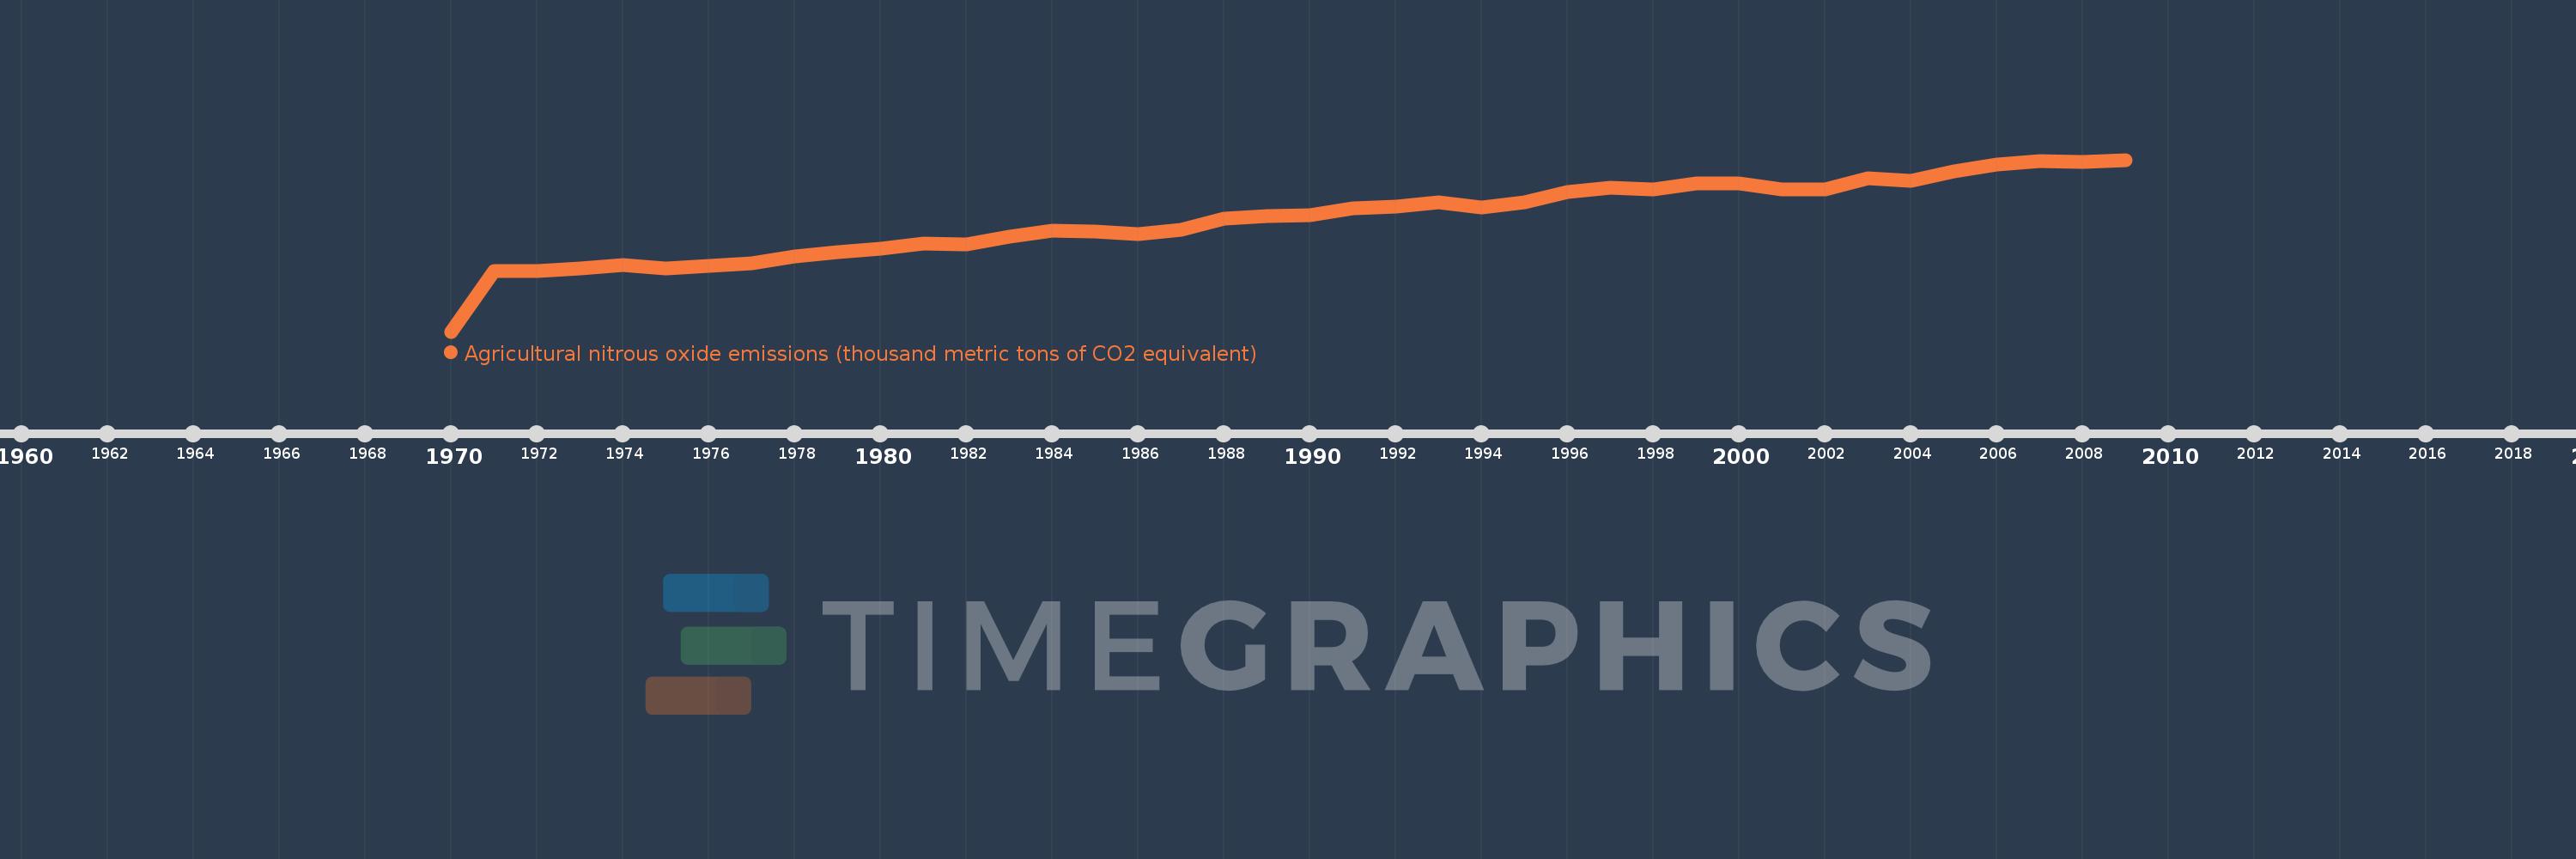
Agricultural nitrous oxide emissions (thousand metric tons of CO2 equivalent)
2009,2008,2007,2006,2005,2004,2003,2002,2001,2000,1999,1998,1997,1996,1995,1994,1993,1992,1991,1990,1989,1988,1987,1986,1985,1984,1983,1982,1981,1980,1979,1978,1977,1976,1975,1974,1973,1972,1971,1970
Diese Statistik in anderen Ländern:
AfghanistanAlbaniaAlgeriaAmerican SamoaAndorraAngolaAntigua and BarbudaArab WorldArgentinaArmeniaArubaAustraliaAustriaAzerbaijanBahamas, TheBahrainBangladeshBarbadosBelarusBelgiumBelizeBeninBermudaBhutanBoliviaBosnia and HerzegovinaBotswanaBrazilBritish Virgin IslandsBrunei DarussalamBulgariaBurkina FasoBurundiCabo VerdeCambodiaCameroonCanadaCaribbean small statesCayman IslandsCentral African RepublicCentral Europe and the BalticsChadChannel IslandsChileChinaColombiaComorosCongo, Dem. Rep.Congo, Rep.Costa RicaCote d'IvoireCroatiaCubaCuracaoCyprusCzech RepublicDenmarkDjiboutiDominicaDominican RepublicEarly-demographic dividendEast Asia & PacificEast Asia & Pacific (excluding high income)East Asia & Pacific (IDA & IBRD countries)EcuadorEgypt, Arab Rep.El SalvadorEquatorial GuineaEritreaEstoniaEthiopiaEuro areaEurope & Central AsiaEurope & Central Asia (excluding high income)Europe & Central Asia (IDA & IBRD countries)European UnionFaroe IslandsFijiFinlandFragile and conflict affected situationsFranceFrench PolynesiaGabonGambia, TheGeorgiaGermanyGhanaGibraltarGreeceGreenlandGrenadaGuamGuatemalaGuineaGuinea-BissauGuyanaHaitiHeavily indebted poor countries (HIPC)High incomeHondurasHong Kong SAR, ChinaHungaryIBRD onlyIcelandIDA & IBRD totalIDA blendIDA onlyIDA totalIndiaIndonesiaIran, Islamic Rep.IraqIrelandIsle of ManIsraelItalyJamaicaJapanJordanKazakhstanKenyaKiribatiKorea, Dem. People’s Rep.Korea, Rep.KosovoKuwaitKyrgyz RepublicLao PDRLate-demographic dividendLatin America & Caribbean Latin America & Caribbean (excluding high income)Latin America & the Caribbean (IDA & IBRD countries)LatviaLeast developed countries: UN classificationLebanonLesothoLiberiaLibyaLiechtensteinLithuaniaLow & middle incomeLow incomeLower middle incomeLuxembourgMacao SAR, ChinaMacedonia, FYRMadagascarMalawiMalaysiaMaldivesMaliMaltaMarshall IslandsMauritaniaMauritiusMexicoMicronesia, Fed. Sts.Middle East & North AfricaMiddle East & North Africa (excluding high income)Middle East & North Africa (IDA & IBRD countries)Middle incomeMoldovaMonacoMongoliaMontenegroMoroccoMozambiqueMyanmarNamibiaNauruNepalNetherlandsNew CaledoniaNew ZealandNicaraguaNigerNigeriaNorth AmericaNorthern Mariana IslandsNorwayOECD membersOmanOther small statesPacific island small statesPakistanPalauPanamaPapua New GuineaParaguayPeruPhilippinesPolandPortugalPost-demographic dividendPre-demographic dividendPuerto RicoQatarRomaniaRussian FederationRwandaSamoaSan MarinoSao Tome and PrincipeSaudi ArabiaSenegalSerbiaSeychellesSierra LeoneSingaporeSint Maarten (Dutch part)Slovak RepublicSloveniaSmall statesSolomon IslandsSomaliaSouth AfricaSouth AsiaSouth Asia (IDA & IBRD)South SudanSpainSri LankaSt. Kitts and NevisSt. LuciaSt. Martin (French part)St. Vincent and the GrenadinesSub-Saharan Africa Sub-Saharan Africa (excluding high income)Sub-Saharan Africa (IDA & IBRD countries)SudanSurinameSwazilandSwedenSwitzerlandSyrian Arab RepublicTajikistanTanzaniaThailandTimor-LesteTogoTongaTrinidad and TobagoTunisiaTurkeyTurkmenistanTurks and Caicos IslandsTuvaluUgandaUkraineUnited Arab EmiratesUnited KingdomUnited StatesUpper middle incomeUruguayUzbekistanVanuatuVenezuela, RBVietnamVirgin Islands (U.S.)West Bank and GazaWorldYemen, Rep.ZambiaZimbabwe Zeitlinie:
Diese Zeitleiste vorliegt die Graphik ab 1970 J. bis 2009 J. East Asia & Pacific (excluding high income). Die Angaben bis 1969 J. sind nicht vorhanden. Die Zahl aktueller Beobachtungen nach Daten: 40.
Die Quelle (Bezeichnung):
Kennzahlen der Weltentwicklung
Die Quelle (Einrichtung):
European Commission, Joint Research Centre (JRC)/Netherlands Environmental Assessment Agency (PBL). Emission Database for Global Atmospheric Research (EDGAR): http://edgar.jrc.ec.europa.eu/
Kategorien:
Agriculture & Rural Development, Environment
Es wurde aktualisiert:
23 Apr 2017 Jahr
Kennzahlen der Wertänderungen vom Jahr zum Jahr
im Durchschnitt:
342.928 Tsnd.
Minimum:
0.0
1 Jan 1970 Jahr
Maximum:
525.762 Tsnd.
1 Jan 2009 Jahr
Zum Datum der Beobachtung
Wert
Absolute Veränderung
Die Veränderung bezüglich dem vorherigen Wert
1 Jan 1970 Jahr
0.0
0.0
0.0%
1 Jan 1971 Jahr
186.615 Tsnd.
+186.615 Tsnd.
%
1 Jan 1972 Jahr
184.719 Tsnd.
-1.897 Tsnd.
-1.02%
1 Jan 1973 Jahr
194.302 Tsnd.
+9.584 Tsnd.
5.19%
1 Jan 1974 Jahr
204.443 Tsnd.
+10.141 Tsnd.
5.22%
1 Jan 1975 Jahr
193.954 Tsnd.
-10.489 Tsnd.
-5.13%
1 Jan 1976 Jahr
201.849 Tsnd.
+7.896 Tsnd.
4.07%
1 Jan 1977 Jahr
210.158 Tsnd.
+8.309 Tsnd.
4.12%
1 Jan 1978 Jahr
230.741 Tsnd.
+20.584 Tsnd.
9.79%
1 Jan 1979 Jahr
243.384 Tsnd.
+12.643 Tsnd.
5.48%
1 Jan 1980 Jahr
253.178 Tsnd.
+9.794 Tsnd.
4.02%
1 Jan 1981 Jahr
269.468 Tsnd.
+16.289 Tsnd.
6.43%
1 Jan 1982 Jahr
267.685 Tsnd.
-1.782 Tsnd.
-0.66%
1 Jan 1983 Jahr
291.07 Tsnd.
+23.385 Tsnd.
8.74%
1 Jan 1984 Jahr
308.142 Tsnd.
+17.072 Tsnd.
5.87%
1 Jan 1985 Jahr
305.854 Tsnd.
-2.288 Tsnd.
-0.74%
1 Jan 1986 Jahr
299.249 Tsnd.
-6.605 Tsnd.
-2.16%
1 Jan 1987 Jahr
310.537 Tsnd.
+11.288 Tsnd.
3.77%
1 Jan 1988 Jahr
346.56 Tsnd.
+36.023 Tsnd.
11.6%
1 Jan 1989 Jahr
352.65 Tsnd.
+6.09 Tsnd.
1.76%
1 Jan 1990 Jahr
355.313 Tsnd.
+2.664 Tsnd.
0.76%
1 Jan 1991 Jahr
376.113 Tsnd.
+20.799 Tsnd.
5.85%
1 Jan 1992 Jahr
382.323 Tsnd.
+6.211 Tsnd.
1.65%
1 Jan 1993 Jahr
395.956 Tsnd.
+13.632 Tsnd.
3.57%
1 Jan 1994 Jahr
378.794 Tsnd.
-17.162 Tsnd.
-4.33%
1 Jan 1995 Jahr
394.366 Tsnd.
+15.572 Tsnd.
4.11%
1 Jan 1996 Jahr
427.965 Tsnd.
+33.599 Tsnd.
8.52%
1 Jan 1997 Jahr
439.467 Tsnd.
+11.502 Tsnd.
2.69%
1 Jan 1998 Jahr
436.21 Tsnd.
-3.257 Tsnd.
-0.74%
1 Jan 1999 Jahr
454.238 Tsnd.
+18.028 Tsnd.
4.13%
1 Jan 2000 Jahr
452.887 Tsnd.
-1.351 Tsnd.
-0.3%
1 Jan 2001 Jahr
435.754 Tsnd.
-17.133 Tsnd.
-3.78%
1 Jan 2002 Jahr
433.845 Tsnd.
-1.909 Tsnd.
-0.44%
1 Jan 2003 Jahr
469.047 Tsnd.
+35.203 Tsnd.
8.11%
1 Jan 2004 Jahr
461.283 Tsnd.
-7.764 Tsnd.
-1.66%
1 Jan 2005 Jahr
490.963 Tsnd.
+29.68 Tsnd.
6.43%
1 Jan 2006 Jahr
510.868 Tsnd.
+19.906 Tsnd.
4.05%
1 Jan 2007 Jahr
522.503 Tsnd.
+11.635 Tsnd.
2.28%
1 Jan 2008 Jahr
518.903 Tsnd.
-3.6 Tsnd.
-0.69%
1 Jan 2009 Jahr
525.762 Tsnd.
+6.859 Tsnd.
1.32%
Bewertung der Länder gemäß mit laufender Statistik nach Jahren


Kommentare: