29
/de/
de
AIzaSyAYiBZKx7MnpbEhh9jyipgxe19OcubqV5w
April 1, 2024
277096
United States
USA
true
2
1
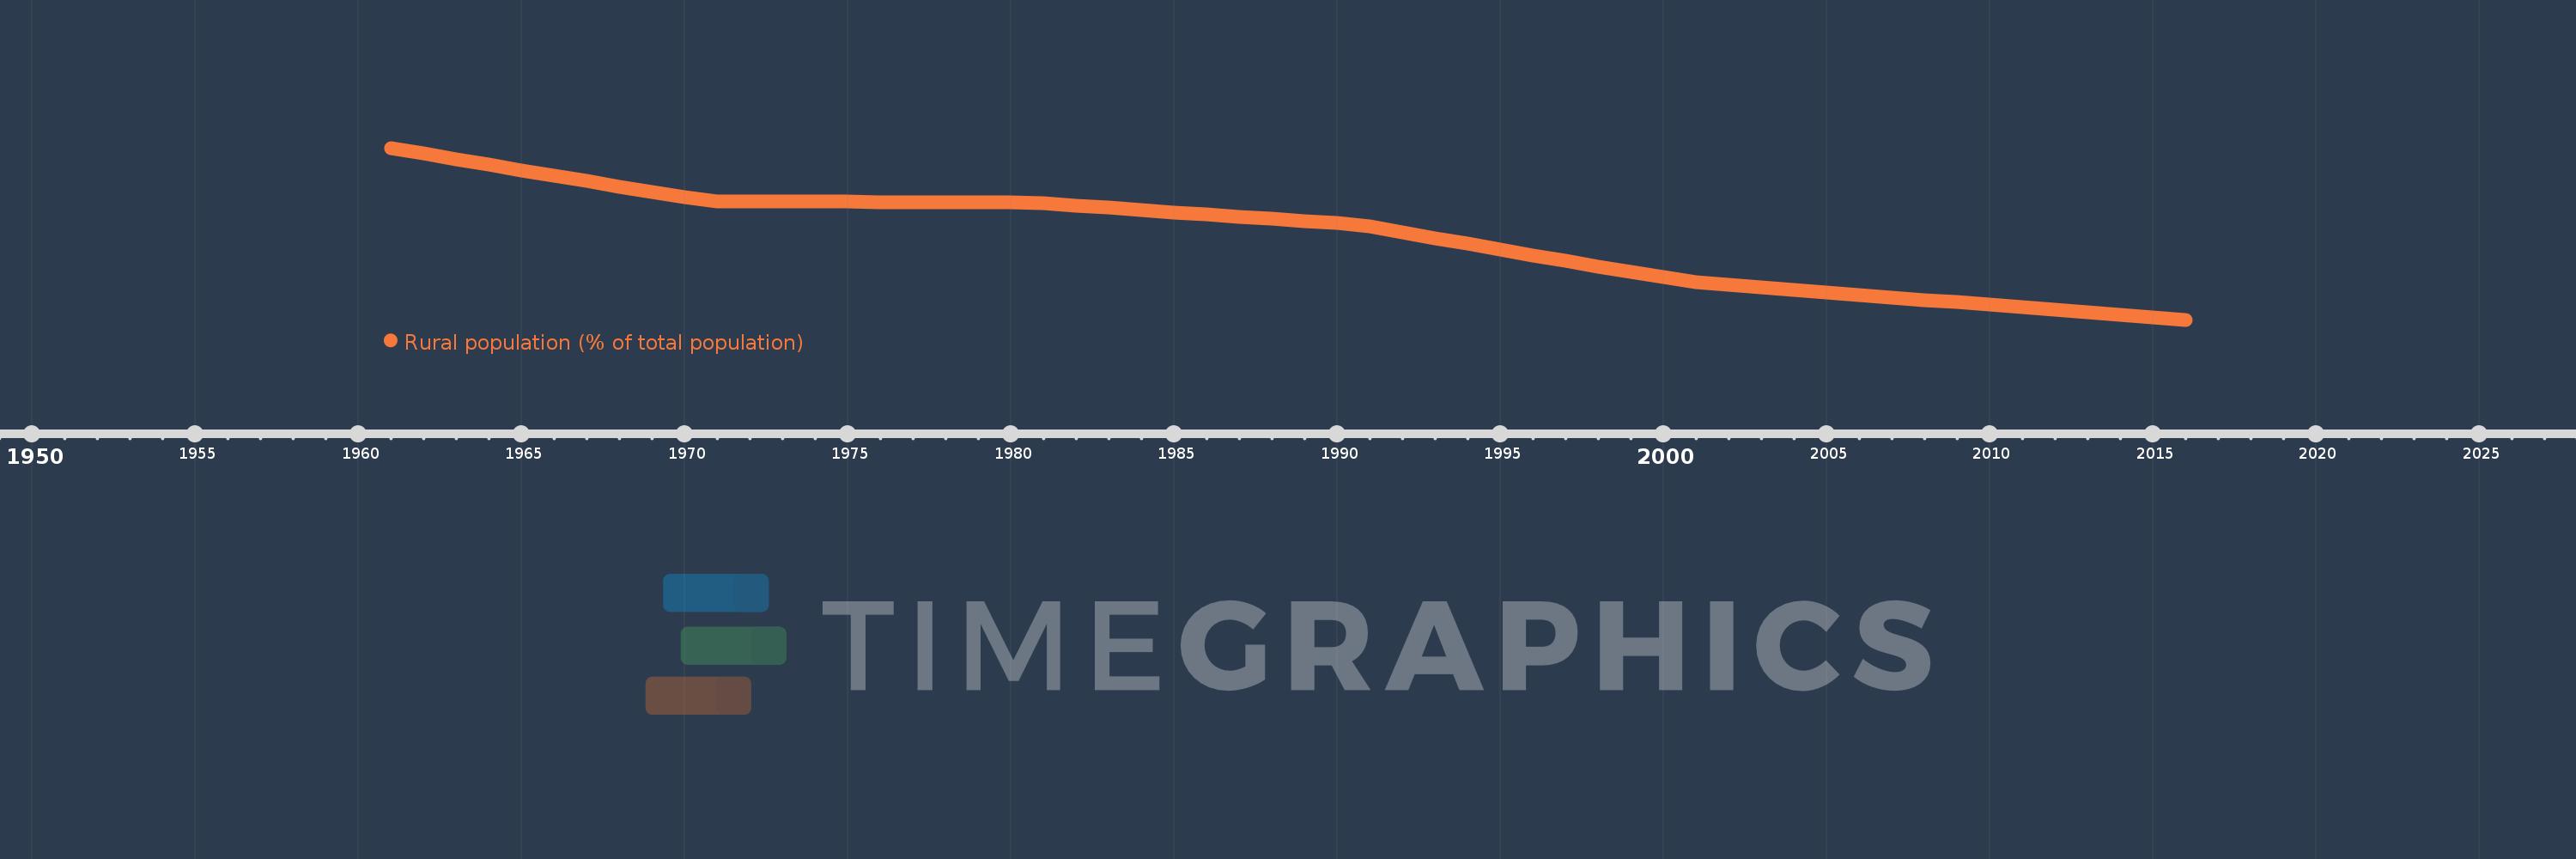
Rural population (% of total population)
2016,2015,2014,2013,2012,2011,2010,2009,2008,2007,2006,2005,2004,2003,2002,2001,2000,1999,1998,1997,1996,1995,1994,1993,1992,1991,1990,1989,1988,1987,1986,1985,1984,1983,1982,1981,1980,1979,1978,1977,1976,1975,1974,1973,1972,1971,1970,1969,1968,1967,1966,1965,1964,1963,1962,1961
Diese Statistik in anderen Ländern:
AfghanistanAlbaniaAlgeriaAmerican SamoaAndorraAngolaAntigua and BarbudaArab WorldArgentinaArmeniaArubaAustraliaAustriaAzerbaijanBahamas, TheBahrainBangladeshBarbadosBelarusBelgiumBelizeBeninBermudaBhutanBoliviaBosnia and HerzegovinaBotswanaBrazilBritish Virgin IslandsBrunei DarussalamBulgariaBurkina FasoBurundiCabo VerdeCambodiaCameroonCanadaCaribbean small statesCayman IslandsCentral African RepublicCentral Europe and the BalticsChadChannel IslandsChileChinaColombiaComorosCongo, Dem. Rep.Congo, Rep.Costa RicaCote d'IvoireCroatiaCubaCuracaoCyprusCzech RepublicDenmarkDjiboutiDominicaDominican RepublicEarly-demographic dividendEast Asia & PacificEast Asia & Pacific (excluding high income)East Asia & Pacific (IDA & IBRD countries)EcuadorEgypt, Arab Rep.El SalvadorEquatorial GuineaEritreaEstoniaEthiopiaEuro areaEurope & Central AsiaEurope & Central Asia (excluding high income)Europe & Central Asia (IDA & IBRD countries)European UnionFaroe IslandsFijiFinlandFragile and conflict affected situationsFranceFrench PolynesiaGabonGambia, TheGeorgiaGermanyGhanaGibraltarGreeceGreenlandGrenadaGuamGuatemalaGuineaGuinea-BissauGuyanaHaitiHeavily indebted poor countries (HIPC)High incomeHondurasHong Kong SAR, ChinaHungaryIBRD onlyIcelandIDA & IBRD totalIDA blendIDA onlyIDA totalIndiaIndonesiaIran, Islamic Rep.IraqIrelandIsle of ManIsraelItalyJamaicaJapanJordanKazakhstanKenyaKiribatiKorea, Dem. People’s Rep.Korea, Rep.KuwaitKyrgyz RepublicLao PDRLate-demographic dividendLatin America & Caribbean Latin America & Caribbean (excluding high income)Latin America & the Caribbean (IDA & IBRD countries)LatviaLeast developed countries: UN classificationLebanonLesothoLiberiaLibyaLiechtensteinLithuaniaLow & middle incomeLow incomeLower middle incomeLuxembourgMacao SAR, ChinaMacedonia, FYRMadagascarMalawiMalaysiaMaldivesMaliMaltaMarshall IslandsMauritaniaMauritiusMexicoMicronesia, Fed. Sts.Middle East & North AfricaMiddle East & North Africa (excluding high income)Middle East & North Africa (IDA & IBRD countries)Middle incomeMoldovaMonacoMongoliaMontenegroMoroccoMozambiqueMyanmarNamibiaNauruNepalNetherlandsNew CaledoniaNew ZealandNicaraguaNigerNigeriaNorth AmericaNorthern Mariana IslandsNorwayOECD membersOmanOther small statesPacific island small statesPakistanPalauPanamaPapua New GuineaParaguayPeruPhilippinesPolandPortugalPost-demographic dividendPre-demographic dividendPuerto RicoQatarRomaniaRussian FederationRwandaSamoaSan MarinoSao Tome and PrincipeSaudi ArabiaSenegalSerbiaSeychellesSierra LeoneSingaporeSint Maarten (Dutch part)Slovak RepublicSloveniaSmall statesSolomon IslandsSomaliaSouth AfricaSouth AsiaSouth Asia (IDA & IBRD)South SudanSpainSri LankaSt. Kitts and NevisSt. LuciaSt. Vincent and the GrenadinesSub-Saharan Africa Sub-Saharan Africa (excluding high income)Sub-Saharan Africa (IDA & IBRD countries)SudanSurinameSwazilandSwedenSwitzerlandSyrian Arab RepublicTajikistanTanzaniaThailandTimor-LesteTogoTongaTrinidad and TobagoTunisiaTurkeyTurkmenistanTurks and Caicos IslandsTuvaluUgandaUkraineUnited Arab EmiratesUnited KingdomUnited StatesUpper middle incomeUruguayUzbekistanVanuatuVenezuela, RBVietnamVirgin Islands (U.S.)West Bank and GazaWorldYemen, Rep.ZambiaZimbabwe Zeitlinie:
Diese Zeitleiste vorliegt die Graphik ab 1961 J. bis 2016 J. United States. Die Angaben bis 1960 J. sind nicht vorhanden. Die Zahl aktueller Beobachtungen nach Daten: 56.
Die Quelle (Bezeichnung):
Kennzahlen der Weltentwicklung
Die Quelle (Einrichtung):
World Bank Staff estimates based on United Nations, World Urbanization Prospects.
Kategorien:
Agriculture & Rural Development
Es wurde aktualisiert:
23 Apr 2017 Jahr
Kennzahlen der Wertänderungen vom Jahr zum Jahr
Minimum:
18.383
1 Jan 2016 Jahr
Maximum:
30.004
1 Jan 1961 Jahr
Zum Datum der Beobachtung
Wert
Absolute Veränderung
Die Veränderung bezüglich dem vorherigen Wert
1 Jan 1961 Jahr
30.004
+30.004
0.0%
1 Jan 1962 Jahr
29.623
-0.381
-1.27%
1 Jan 1963 Jahr
29.243
-0.38
-1.28%
1 Jan 1964 Jahr
28.866
-0.377
-1.29%
1 Jan 1965 Jahr
28.492
-0.374
-1.3%
1 Jan 1966 Jahr
28.121
-0.371
-1.3%
1 Jan 1967 Jahr
27.753
-0.368
-1.31%
1 Jan 1968 Jahr
27.388
-0.365
-1.32%
1 Jan 1969 Jahr
27.026
-0.362
-1.32%
1 Jan 1970 Jahr
26.667
-0.359
-1.33%
1 Jan 1971 Jahr
26.398
-0.269
-1.01%
1 Jan 1972 Jahr
26.387
-0.011
-0.04%
1 Jan 1973 Jahr
26.377
-0.01
-0.04%
1 Jan 1974 Jahr
26.367
-0.01
-0.04%
1 Jan 1975 Jahr
26.357
-0.01
-0.04%
1 Jan 1976 Jahr
26.347
-0.01
-0.04%
1 Jan 1977 Jahr
26.337
-0.01
-0.04%
1 Jan 1978 Jahr
26.327
-0.01
-0.04%
1 Jan 1979 Jahr
26.318
-0.009
-0.03%
1 Jan 1980 Jahr
26.308
-0.01
-0.04%
1 Jan 1981 Jahr
26.262
-0.046
-0.17%
1 Jan 1982 Jahr
26.11
-0.152
-0.58%
1 Jan 1983 Jahr
25.958
-0.152
-0.58%
1 Jan 1984 Jahr
25.806
-0.152
-0.59%
1 Jan 1985 Jahr
25.656
-0.15
-0.58%
1 Jan 1986 Jahr
25.506
-0.15
-0.58%
1 Jan 1987 Jahr
25.356
-0.15
-0.59%
1 Jan 1988 Jahr
25.207
-0.149
-0.59%
1 Jan 1989 Jahr
25.058
-0.149
-0.59%
1 Jan 1990 Jahr
24.911
-0.147
-0.59%
1 Jan 1991 Jahr
24.7
-0.211
-0.85%
1 Jan 1992 Jahr
24.299
-0.401
-1.62%
1 Jan 1993 Jahr
23.903
-0.396
-1.63%
1 Jan 1994 Jahr
23.512
-0.391
-1.64%
1 Jan 1995 Jahr
23.125
-0.387
-1.65%
1 Jan 1996 Jahr
22.743
-0.382
-1.65%
1 Jan 1997 Jahr
22.364
-0.379
-1.67%
1 Jan 1998 Jahr
21.992
-0.372
-1.66%
1 Jan 1999 Jahr
21.623
-0.369
-1.68%
1 Jan 2000 Jahr
21.258
-0.365
-1.69%
1 Jan 2001 Jahr
20.943
-0.315
-1.48%
1 Jan 2002 Jahr
20.766
-0.177
-0.85%
1 Jan 2003 Jahr
20.591
-0.175
-0.84%
1 Jan 2004 Jahr
20.417
-0.174
-0.85%
1 Jan 2005 Jahr
20.243
-0.174
-0.85%
1 Jan 2006 Jahr
20.072
-0.171
-0.84%
1 Jan 2007 Jahr
19.901
-0.171
-0.85%
1 Jan 2008 Jahr
19.731
-0.17
-0.85%
1 Jan 2009 Jahr
19.562
-0.169
-0.86%
1 Jan 2010 Jahr
19.394
-0.168
-0.86%
1 Jan 2011 Jahr
19.228
-0.166
-0.86%
1 Jan 2012 Jahr
19.06
-0.168
-0.87%
1 Jan 2013 Jahr
18.892
-0.168
-0.88%
1 Jan 2014 Jahr
18.723
-0.169
-0.89%
1 Jan 2015 Jahr
18.553
-0.17
-0.91%
1 Jan 2016 Jahr
18.383
-0.17
-0.92%
Bewertung der Länder gemäß mit laufender Statistik nach Jahren


Kommentare: