29
/de/
de
AIzaSyAYiBZKx7MnpbEhh9jyipgxe19OcubqV5w
April 1, 2024
276634
United States
USA
true
2
1
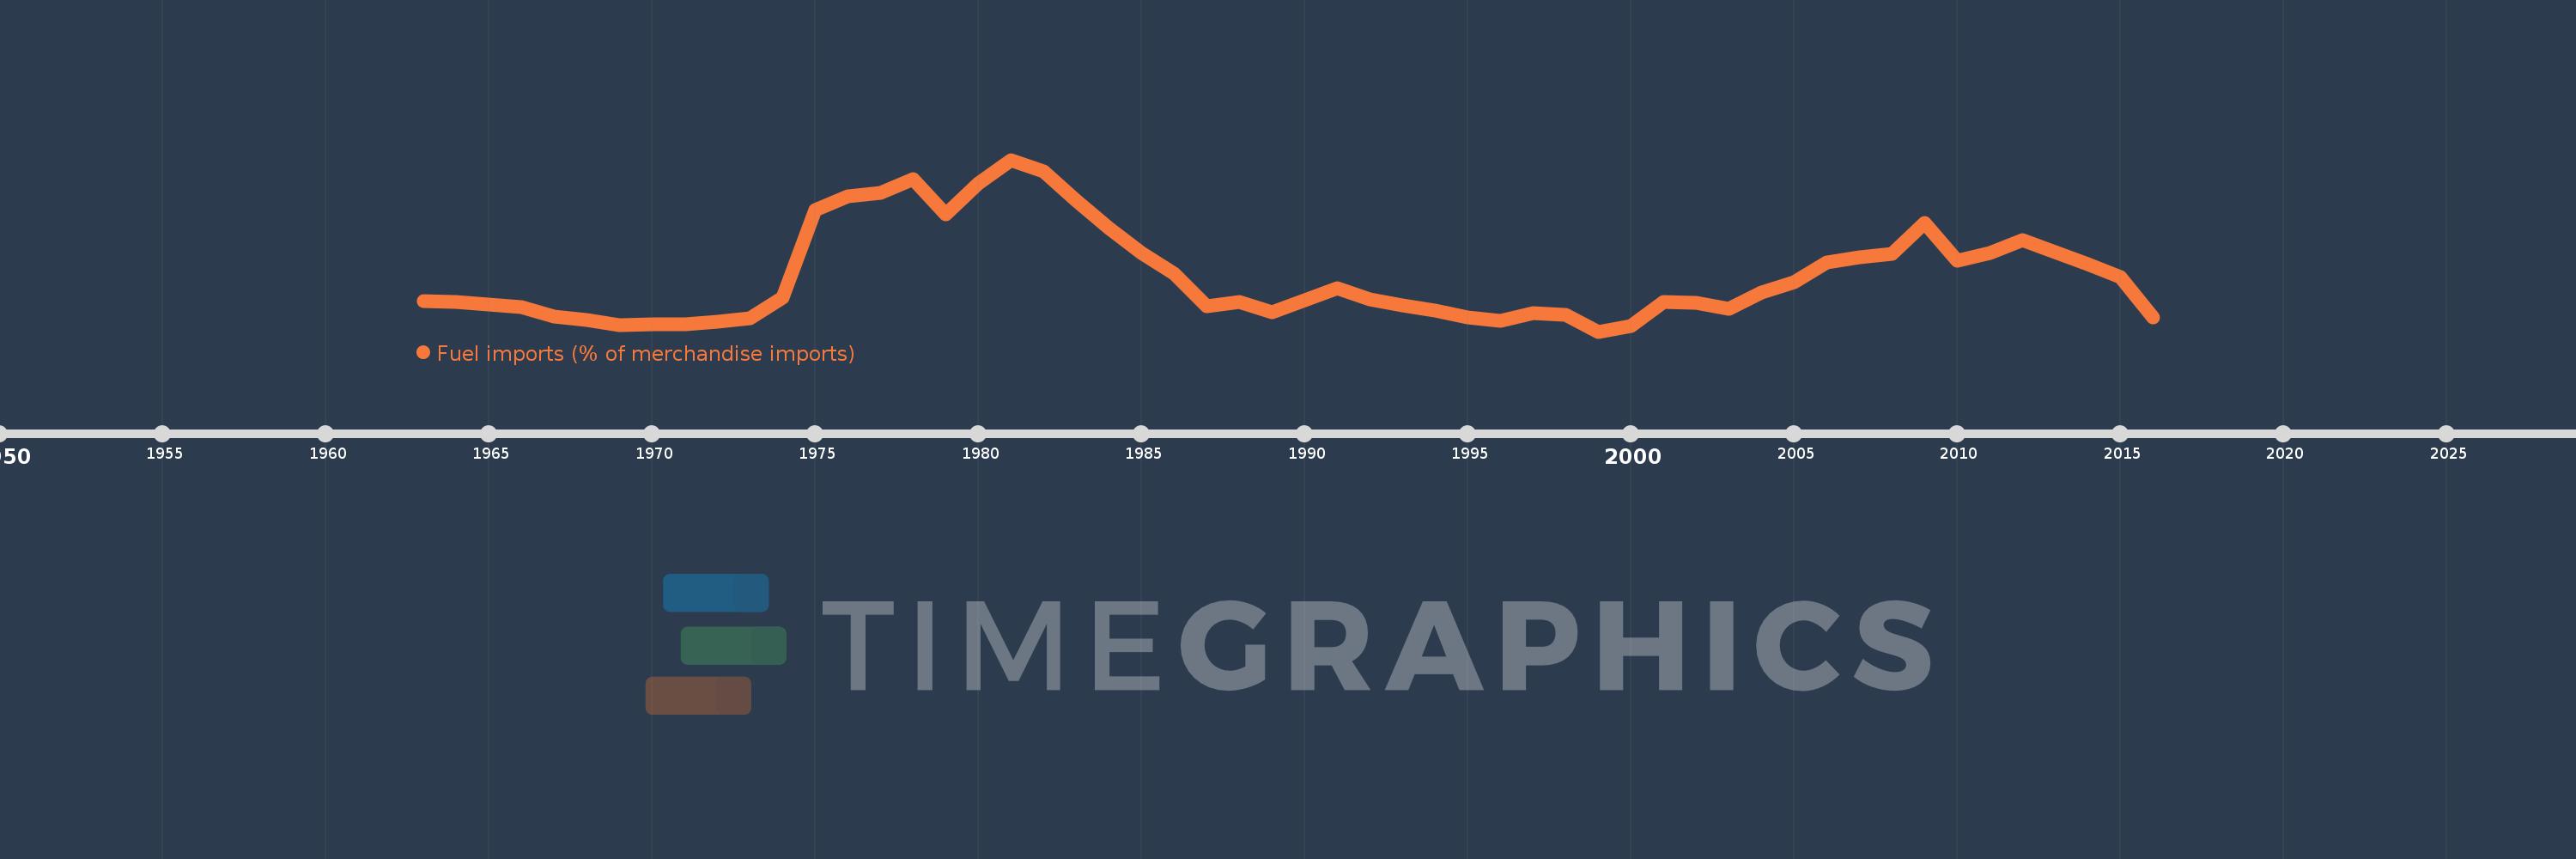
Fuel imports (% of merchandise imports)
2016,2015,2014,2013,2012,2011,2010,2009,2008,2007,2006,2005,2004,2003,2002,2001,2000,1999,1998,1997,1996,1995,1994,1993,1992,1991,1990,1989,1988,1987,1986,1985,1984,1983,1982,1981,1980,1979,1978,1977,1976,1975,1974,1973,1972,1971,1970,1969,1968,1967,1966,1965,1964,1963
Diese Statistik in anderen Ländern:
AfghanistanAlbaniaAlgeriaAndorraAngolaAntigua and BarbudaArab WorldArgentinaArmeniaArubaAustraliaAustriaAzerbaijanBahamas, TheBahrainBangladeshBarbadosBelarusBelgiumBelizeBeninBermudaBhutanBoliviaBosnia and HerzegovinaBotswanaBrazilBrunei DarussalamBulgariaBurkina FasoBurundiCabo VerdeCambodiaCameroonCanadaCaribbean small statesCayman IslandsCentral African RepublicCentral Europe and the BalticsChadChileChinaColombiaComorosCongo, Dem. Rep.Congo, Rep.Costa RicaCote d'IvoireCroatiaCubaCyprusCzech RepublicDenmarkDjiboutiDominicaDominican RepublicEarly-demographic dividendEast Asia & PacificEast Asia & Pacific (excluding high income)East Asia & Pacific (IDA & IBRD countries)EcuadorEgypt, Arab Rep.El SalvadorEquatorial GuineaEritreaEstoniaEthiopiaEuro areaEurope & Central AsiaEurope & Central Asia (excluding high income)Europe & Central Asia (IDA & IBRD countries)European UnionFaroe IslandsFijiFinlandFragile and conflict affected situationsFranceFrench PolynesiaGabonGambia, TheGeorgiaGermanyGhanaGreeceGreenlandGrenadaGuatemalaGuineaGuinea-BissauGuyanaHaitiHeavily indebted poor countries (HIPC)High incomeHondurasHong Kong SAR, ChinaHungaryIBRD onlyIcelandIDA & IBRD totalIDA blendIDA onlyIDA totalIndiaIndonesiaIran, Islamic Rep.IraqIrelandIsraelItalyJamaicaJapanJordanKazakhstanKenyaKiribatiKorea, Rep.KuwaitKyrgyz RepublicLao PDRLate-demographic dividendLatin America & Caribbean Latin America & Caribbean (excluding high income)Latin America & the Caribbean (IDA & IBRD countries)LatviaLeast developed countries: UN classificationLebanonLesothoLiberiaLibyaLithuaniaLow & middle incomeLow incomeLower middle incomeLuxembourgMacao SAR, ChinaMacedonia, FYRMadagascarMalawiMalaysiaMaldivesMaliMaltaMauritaniaMauritiusMexicoMiddle East & North AfricaMiddle East & North Africa (excluding high income)Middle East & North Africa (IDA & IBRD countries)Middle incomeMoldovaMongoliaMoroccoMozambiqueMyanmarNamibiaNepalNetherlandsNew CaledoniaNew ZealandNicaraguaNigerNigeriaNorth AmericaNorwayOECD membersOmanOther small statesPacific island small statesPakistanPalauPanamaPapua New GuineaParaguayPeruPhilippinesPolandPortugalPost-demographic dividendPre-demographic dividendQatarRomaniaRussian FederationRwandaSamoaSao Tome and PrincipeSaudi ArabiaSenegalSerbiaSeychellesSierra LeoneSingaporeSlovak RepublicSloveniaSmall statesSolomon IslandsSomaliaSouth AfricaSouth AsiaSouth Asia (IDA & IBRD)SpainSri LankaSt. Kitts and NevisSt. LuciaSt. Vincent and the GrenadinesSub-Saharan Africa Sub-Saharan Africa (excluding high income)Sub-Saharan Africa (IDA & IBRD countries)SudanSurinameSwazilandSwedenSwitzerlandSyrian Arab RepublicTajikistanTanzaniaThailandTimor-LesteTogoTongaTrinidad and TobagoTunisiaTurkeyTurkmenistanTurks and Caicos IslandsTuvaluUgandaUkraineUnited Arab EmiratesUnited KingdomUnited StatesUpper middle incomeUruguayVanuatuVenezuela, RBVietnamVirgin Islands (U.S.)WorldYemen, Rep.ZambiaZimbabwe Zeitlinie:
Diese Zeitleiste vorliegt die Graphik ab 1963 J. bis 2016 J. United States. Die Angaben bis 1962 J. sind nicht vorhanden. Die Zahl aktueller Beobachtungen nach Daten: 54.
Die Quelle (Bezeichnung):
Kennzahlen der Weltentwicklung
Die Quelle (Einrichtung):
World Bank staff estimates from the Comtrade database maintained by the United Nations Statistics Division.
Kategorien:
Energy & Mining, Private Sector, Trade
Es wurde aktualisiert:
23 Apr 2017 Jahr
Kennzahlen der Wertänderungen vom Jahr zum Jahr
Minimum:
6.601
1 Jan 1999 Jahr
Maximum:
32.845
1 Jan 1981 Jahr
Zum Datum der Beobachtung
Wert
Absolute Veränderung
Die Veränderung bezüglich dem vorherigen Wert
1 Jan 1963 Jahr
11.254
+11.254
0.0%
1 Jan 1964 Jahr
11.067
-0.187
-1.66%
1 Jan 1965 Jahr
10.732
-0.335
-3.03%
1 Jan 1966 Jahr
10.401
-0.331
-3.08%
1 Jan 1967 Jahr
8.853
-1.548
-14.88%
1 Jan 1968 Jahr
8.391
-0.462
-5.22%
1 Jan 1969 Jahr
7.636
-0.755
-8.99%
1 Jan 1970 Jahr
7.752
+0.116
1.52%
1 Jan 1971 Jahr
7.696
-0.056
-0.72%
1 Jan 1972 Jahr
8.153
+0.457
5.94%
1 Jan 1973 Jahr
8.637
+0.484
5.94%
1 Jan 1974 Jahr
11.764
+3.127
36.21%
1 Jan 1975 Jahr
25.126
+13.362
113.57%
1 Jan 1976 Jahr
27.248
+2.122
8.44%
1 Jan 1977 Jahr
27.857
+0.61
2.24%
1 Jan 1978 Jahr
29.893
+2.036
7.31%
1 Jan 1979 Jahr
24.526
-5.367
-17.95%
1 Jan 1980 Jahr
29.29
+4.764
19.42%
1 Jan 1981 Jahr
32.845
+3.555
12.14%
1 Jan 1982 Jahr
31.068
-1.777
-5.41%
1 Jan 1983 Jahr
26.646
-4.422
-14.23%
1 Jan 1984 Jahr
22.39
-4.256
-15.97%
1 Jan 1985 Jahr
18.651
-3.74
-16.7%
1 Jan 1986 Jahr
15.523
-3.128
-16.77%
1 Jan 1987 Jahr
10.428
-5.095
-32.82%
1 Jan 1988 Jahr
11.066
+0.638
6.12%
1 Jan 1989 Jahr
9.609
-1.457
-13.16%
1 Jan 1990 Jahr
11.363
+1.754
18.25%
1 Jan 1991 Jahr
13.257
+1.894
16.67%
1 Jan 1992 Jahr
11.467
-1.79
-13.5%
1 Jan 1993 Jahr
10.62
-0.847
-7.38%
1 Jan 1994 Jahr
9.848
-0.773
-7.28%
1 Jan 1995 Jahr
8.733
-1.114
-11.31%
1 Jan 1996 Jahr
8.19
-0.544
-6.22%
1 Jan 1997 Jahr
9.446
+1.256
15.34%
1 Jan 1998 Jahr
9.215
-0.232
-2.45%
1 Jan 1999 Jahr
6.601
-2.614
-28.37%
1 Jan 2000 Jahr
7.496
+0.895
13.56%
1 Jan 2001 Jahr
11.1
+3.604
48.08%
1 Jan 2002 Jahr
10.936
-0.164
-1.48%
1 Jan 2003 Jahr
10.136
-0.8
-7.32%
1 Jan 2004 Jahr
12.509
+2.373
23.41%
1 Jan 2005 Jahr
14.175
+1.666
13.32%
1 Jan 2006 Jahr
17.196
+3.02
21.31%
1 Jan 2007 Jahr
17.974
+0.778
4.52%
1 Jan 2008 Jahr
18.417
+0.444
2.47%
1 Jan 2009 Jahr
23.182
+4.765
25.87%
1 Jan 2010 Jahr
17.477
-5.705
-24.61%
1 Jan 2011 Jahr
18.588
+1.111
6.36%
1 Jan 2012 Jahr
20.552
+1.964
10.56%
1 Jan 2013 Jahr
18.761
-1.79
-8.71%
1 Jan 2014 Jahr
16.857
-1.904
-10.15%
1 Jan 2015 Jahr
14.921
-1.936
-11.49%
1 Jan 2016 Jahr
8.74
-6.18
-41.42%
Bewertung der Länder gemäß mit laufender Statistik nach Jahren


Kommentare: